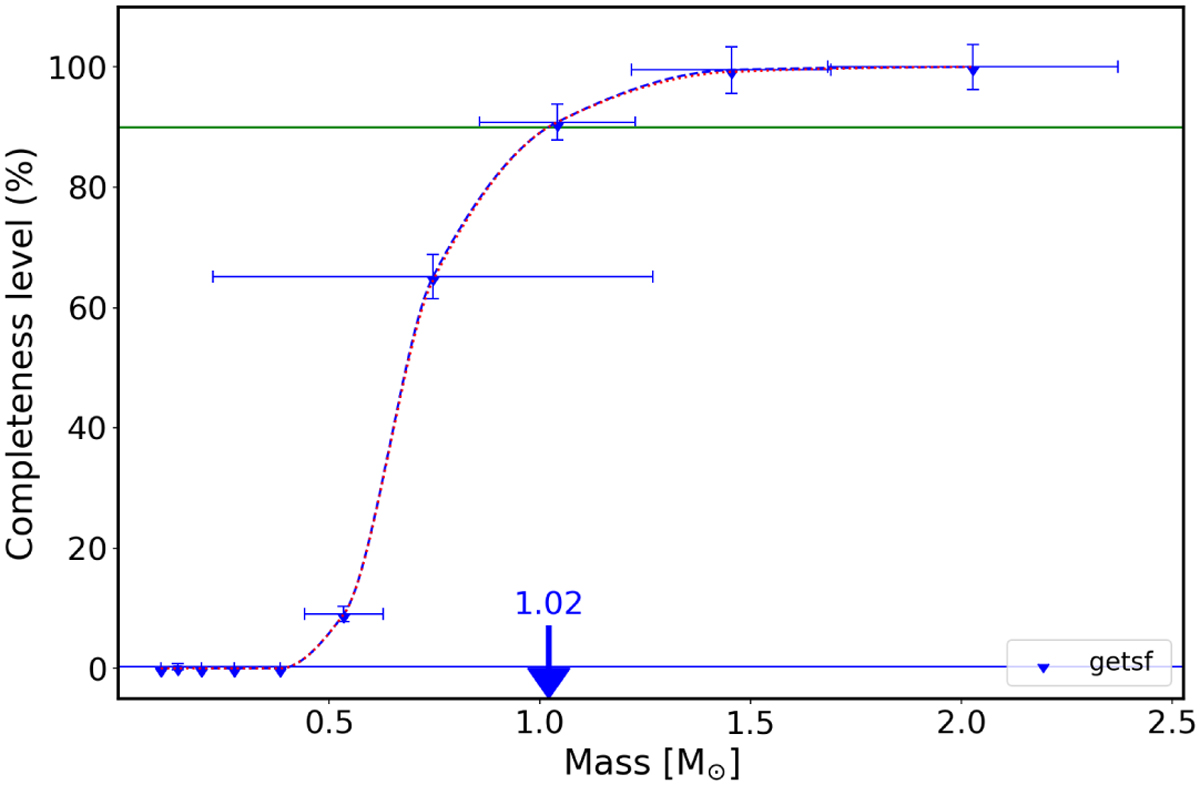
Fig. B.1
Download original image
Completeness level of ~800 synthetic cores added on background image of W33-Main. The core content is 90% complete down to 1.0 ± 0.2 M⊙ for the getsf catalogue. The error bars represent the ±1σ uncertainties for mass estimates across each bin (x-axis) and total cores retrieved per bin (y-axis). Data points were interpolated using the piecewise cubic hermite interpolating polynomial method. Blue points represent the full sample of cores detected by getsf
Current usage metrics show cumulative count of Article Views (full-text article views including HTML views, PDF and ePub downloads, according to the available data) and Abstracts Views on Vision4Press platform.
Data correspond to usage on the plateform after 2015. The current usage metrics is available 48-96 hours after online publication and is updated daily on week days.
Initial download of the metrics may take a while.