Fig. 14
Download original image
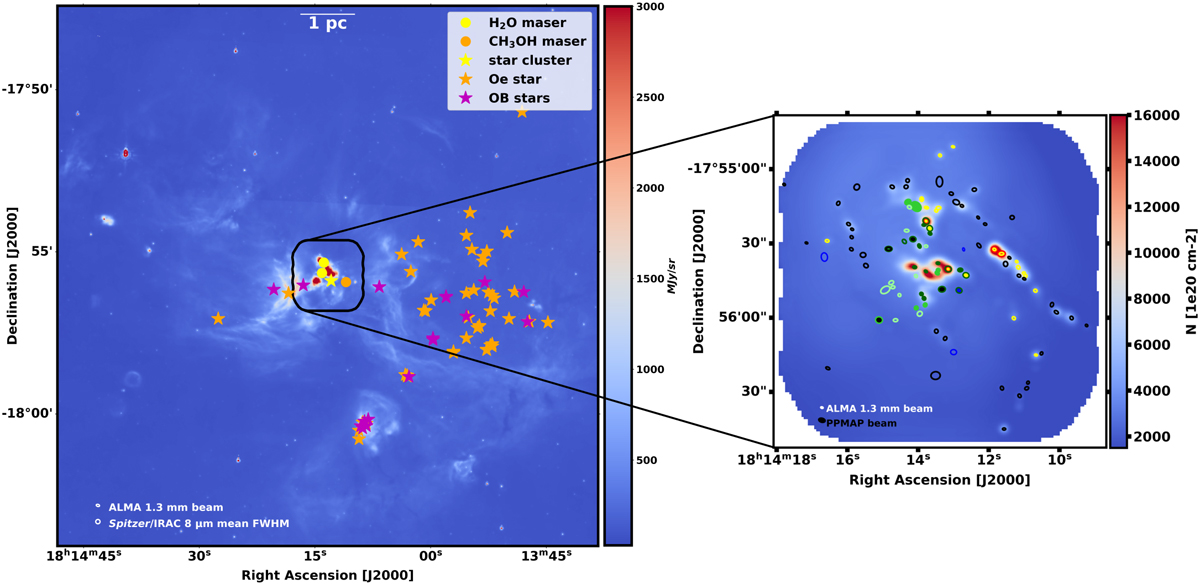
Overview of W33 complex and stars within. Left: overview of W33 region seen in the 8 μm channel of the Spitzer telescope with a 2″ resolution. The coloured markers show the massive infrared sources identified using Spitzer/IRAC (Messineo et al. 2015). Right: PPMAP column density map with a 2.5″ resolution, with the cores from the getsf filtered core catalogue. The colours represent the different categories of cores identified in Figs. 9 and 10. The filled cores correspond to the ones located inside the H II regions and their surroundings (see definition in Sect. 3.5).
Current usage metrics show cumulative count of Article Views (full-text article views including HTML views, PDF and ePub downloads, according to the available data) and Abstracts Views on Vision4Press platform.
Data correspond to usage on the plateform after 2015. The current usage metrics is available 48-96 hours after online publication and is updated daily on week days.
Initial download of the metrics may take a while.