Fig. 12
Download original image
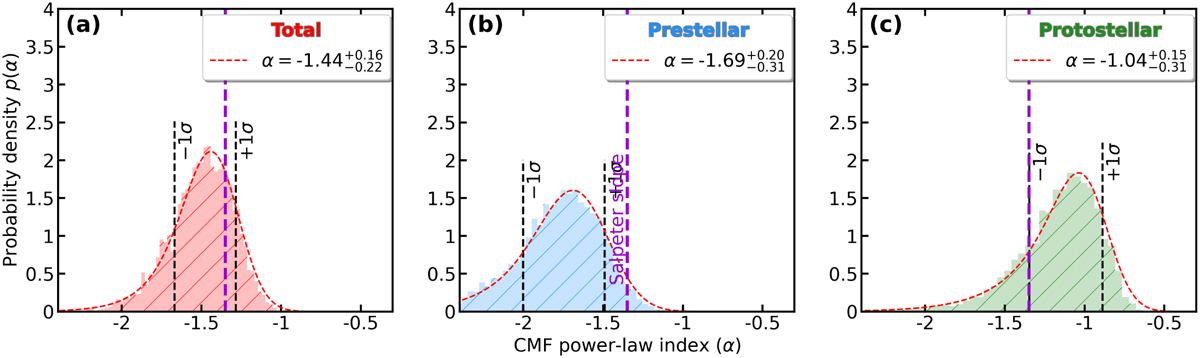
Probability density as function of slope value of high-mass end of the CMF for (a) the global CMF in W33-Main, and (b) and (c) the prestellar and protostellar sub-populations of scenario A. The coloured histograms result from a bootstrap procedure including using the Alstott et al. (2014) method. The best slope value estimate, its uncertainty, and the starting point of the fit were determined by an exponentially modified Gaussian (EMG) (red dashed line). The 1σ errors (represented as vertical back-dashed lines) were determined by taking 68% of the slope values before and after the peak of the distribution. The Salpeter slope is represented by a purple-dashed line.
Current usage metrics show cumulative count of Article Views (full-text article views including HTML views, PDF and ePub downloads, according to the available data) and Abstracts Views on Vision4Press platform.
Data correspond to usage on the plateform after 2015. The current usage metrics is available 48-96 hours after online publication and is updated daily on week days.
Initial download of the metrics may take a while.