Fig. 11
Download original image
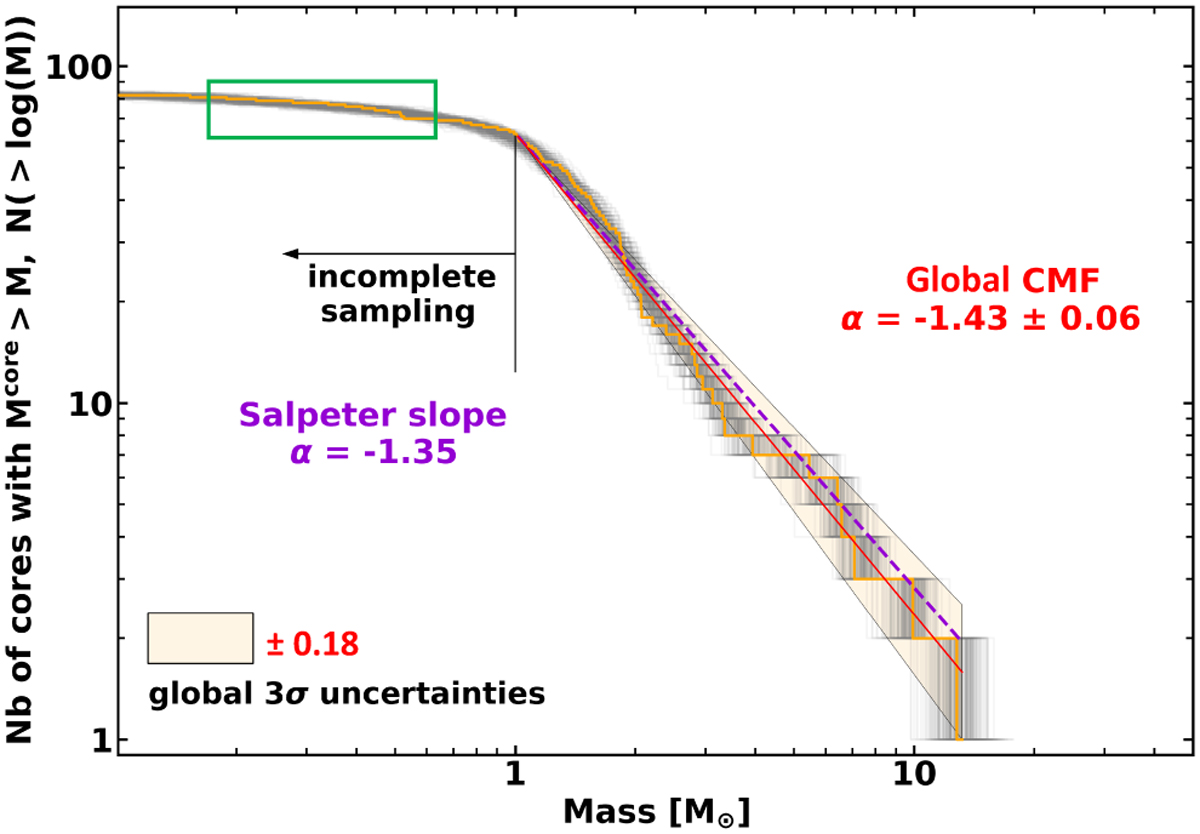
Cumulative CMFs using temperature map (orange histogram and red curve). The mass-driven uncertainty is represented by grey histograms, and the global uncertainty is represented by a yellow-ish box (see Pouteau et al. 2022 for details). We represent the fit resulting from Salpeter value in a dashed purple line. The green box locates the seven free-free uncertain cores and the four CO-contaminated cores. The vertical black segment shows the completeness limit (1.0 M⊙).
Current usage metrics show cumulative count of Article Views (full-text article views including HTML views, PDF and ePub downloads, according to the available data) and Abstracts Views on Vision4Press platform.
Data correspond to usage on the plateform after 2015. The current usage metrics is available 48-96 hours after online publication and is updated daily on week days.
Initial download of the metrics may take a while.