Fig. 12
Download original image
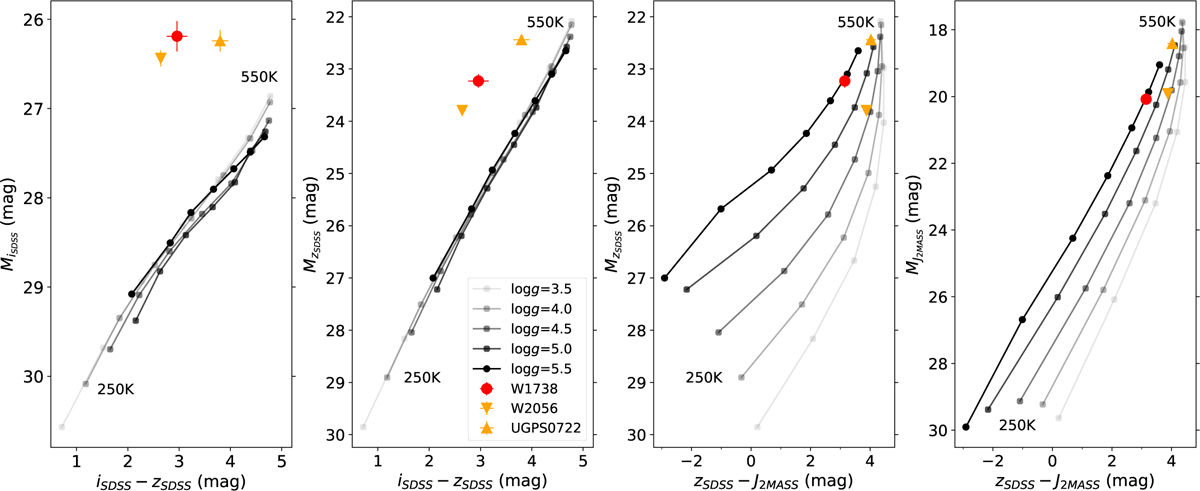
Hertzsprung-Russell diagrams of absolute Sloan i and ɀ magnitude versus i − ɀ colour and absolute ɀ and J magnitude versus ɀ − J colour. W1738, W2056, and UGPS0722 were plotted directly using their photometry, except that the i-band magnitude of W2056 is derived from its ɀ-band magnitude and the i − ɀ colour is from its spectrum. The SONORA solar-metallicity theoretical model from Marley et al. (2021) of different surface gravities from 3.5 to 5.5 and of effective temperatures from 550 to 250 K with a step of 50 K are plotted. We concluded that the abnormality of the blue i − ɀ colour of the Y dwarfs in the Fig. 11 is caused by its excess flux in the i-band.
Current usage metrics show cumulative count of Article Views (full-text article views including HTML views, PDF and ePub downloads, according to the available data) and Abstracts Views on Vision4Press platform.
Data correspond to usage on the plateform after 2015. The current usage metrics is available 48-96 hours after online publication and is updated daily on week days.
Initial download of the metrics may take a while.