Fig. 5.
Download original image
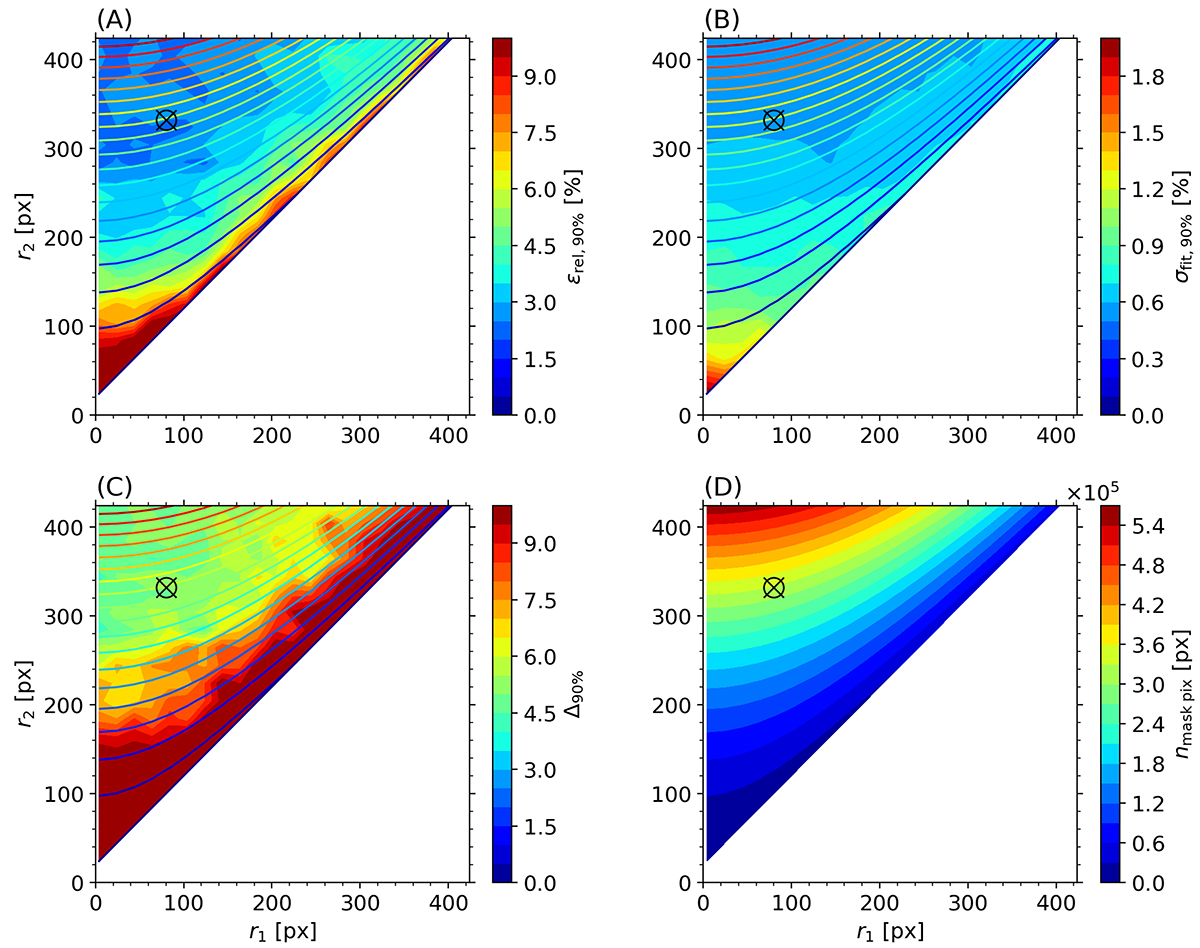
Colour maps for the reference galaxy when applying different masks (r1, r2): the 90% percentile of the relative error in panel (A), up to εrel, 90% ≥ 10%; the 90% percentile of the relative standard deviation in panel (B), up to σfit, 90% ≤ 2%; the relative 90% width of the ![]() distribution in panel (C), up to Δ90% ≤ 10%; and the number of pixels within each one of the masks (nmask pix) in panel (D). The contour lines found over the map in panels (A), (B) and (C) correspond to the number of pixels shown in panel (D). The black circled-cross signals the reference galaxy presented in Sect. 2.1 with the mask applied in its source reference Cantiello et al. (2018); r1 ≈ 80 px, r2 ≈ 332 px).
distribution in panel (C), up to Δ90% ≤ 10%; and the number of pixels within each one of the masks (nmask pix) in panel (D). The contour lines found over the map in panels (A), (B) and (C) correspond to the number of pixels shown in panel (D). The black circled-cross signals the reference galaxy presented in Sect. 2.1 with the mask applied in its source reference Cantiello et al. (2018); r1 ≈ 80 px, r2 ≈ 332 px).
Current usage metrics show cumulative count of Article Views (full-text article views including HTML views, PDF and ePub downloads, according to the available data) and Abstracts Views on Vision4Press platform.
Data correspond to usage on the plateform after 2015. The current usage metrics is available 48-96 hours after online publication and is updated daily on week days.
Initial download of the metrics may take a while.