Fig. 4.
Download original image
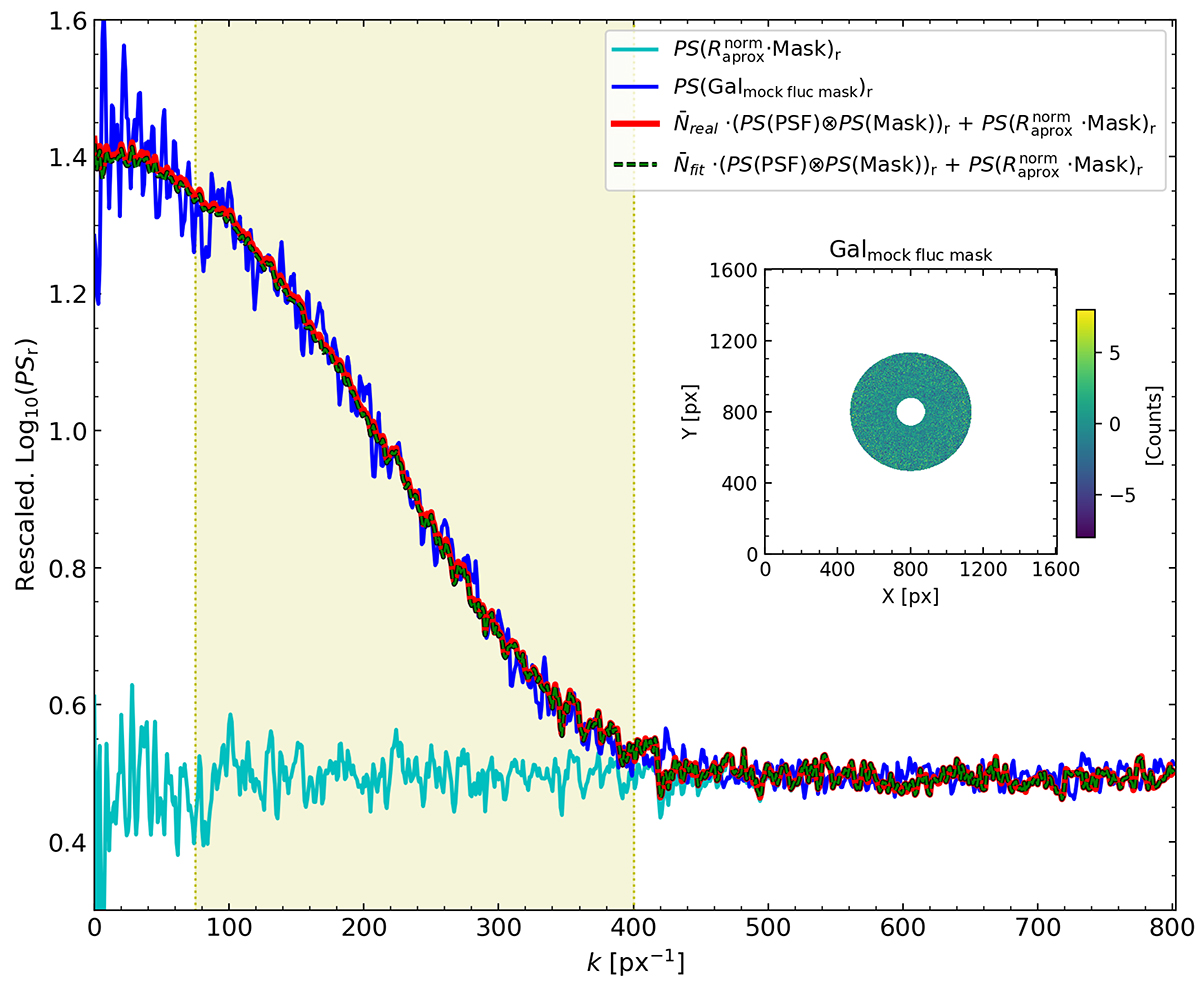
Rescaled (multiplied by PS(PSF)r/(PS(PSF)⊗PS(Mask))r) logarithm of the radial power spectrum profiles: the masked instrumental noise term (![]() ) is the cyan line; the observed masked fluctuation (PS(Galmock fluc mask)r) is the blue line; the right part of Eq. (21) with the real input value of the SBF (
) is the cyan line; the observed masked fluctuation (PS(Galmock fluc mask)r) is the blue line; the right part of Eq. (21) with the real input value of the SBF (![]() ) is the red line, and with the fitted fluctuation (
) is the red line, and with the fitted fluctuation (![]() ) is the dashed green line. The selected range of frequencies where the fitting is performed happens between kfit, i = 75 px−1 and kfit, f = 400 px−1, marked with a pale yellow vertical region. In this example, the input SBF value is
) is the dashed green line. The selected range of frequencies where the fitting is performed happens between kfit, i = 75 px−1 and kfit, f = 400 px−1, marked with a pale yellow vertical region. In this example, the input SBF value is ![]() and the fitted SBF is
and the fitted SBF is ![]() . The embed image is the observed fluctuation Galmock fluc mask with a circular mask of r1 ≈ 80 px and r2 ≈ 332 px applied.
. The embed image is the observed fluctuation Galmock fluc mask with a circular mask of r1 ≈ 80 px and r2 ≈ 332 px applied.
Current usage metrics show cumulative count of Article Views (full-text article views including HTML views, PDF and ePub downloads, according to the available data) and Abstracts Views on Vision4Press platform.
Data correspond to usage on the plateform after 2015. The current usage metrics is available 48-96 hours after online publication and is updated daily on week days.
Initial download of the metrics may take a while.