Fig. 2.

Download original image
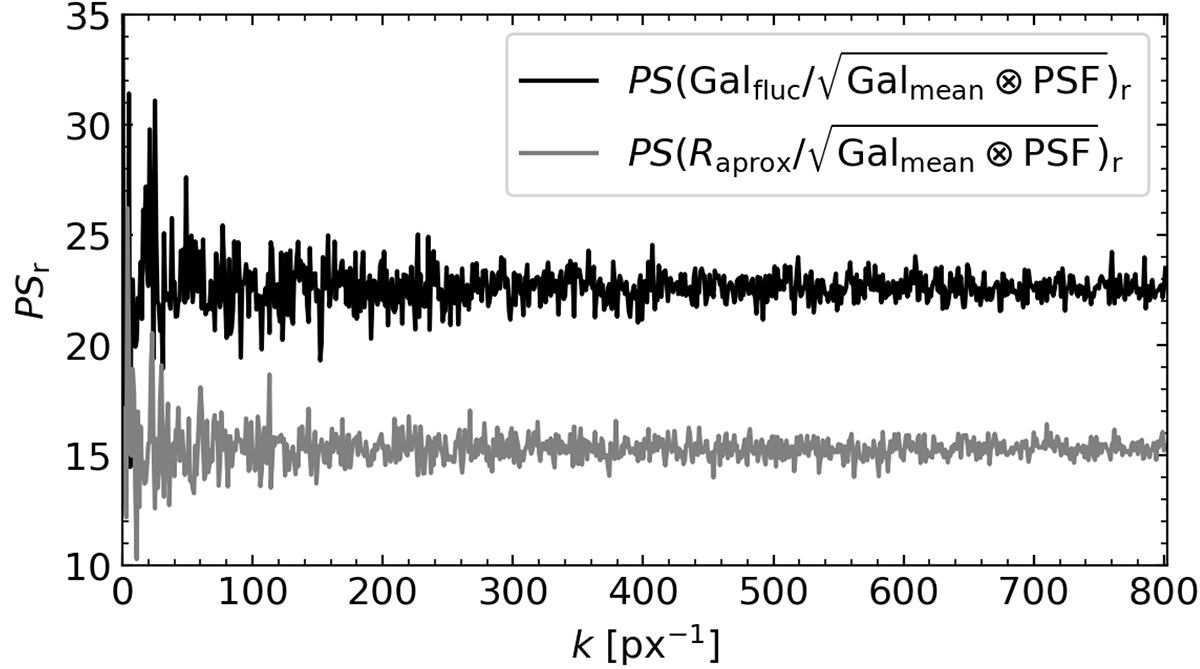
Azimuthally averaged power spectrum of both fluctuation contributions: the stellar population luminosity variability (![]() ) is in black and the instrumental noise (
) is in black and the instrumental noise (![]() ) is in grey. In this case we consider a mask, introduced as in Eq. (21), with the same data used in Fig. 4. Note that the input SBF value (
) is in grey. In this case we consider a mask, introduced as in Eq. (21), with the same data used in Fig. 4. Note that the input SBF value (![]() counts) coincides with the average value of the fluctuation term.
counts) coincides with the average value of the fluctuation term.
Current usage metrics show cumulative count of Article Views (full-text article views including HTML views, PDF and ePub downloads, according to the available data) and Abstracts Views on Vision4Press platform.
Data correspond to usage on the plateform after 2015. The current usage metrics is available 48-96 hours after online publication and is updated daily on week days.
Initial download of the metrics may take a while.


