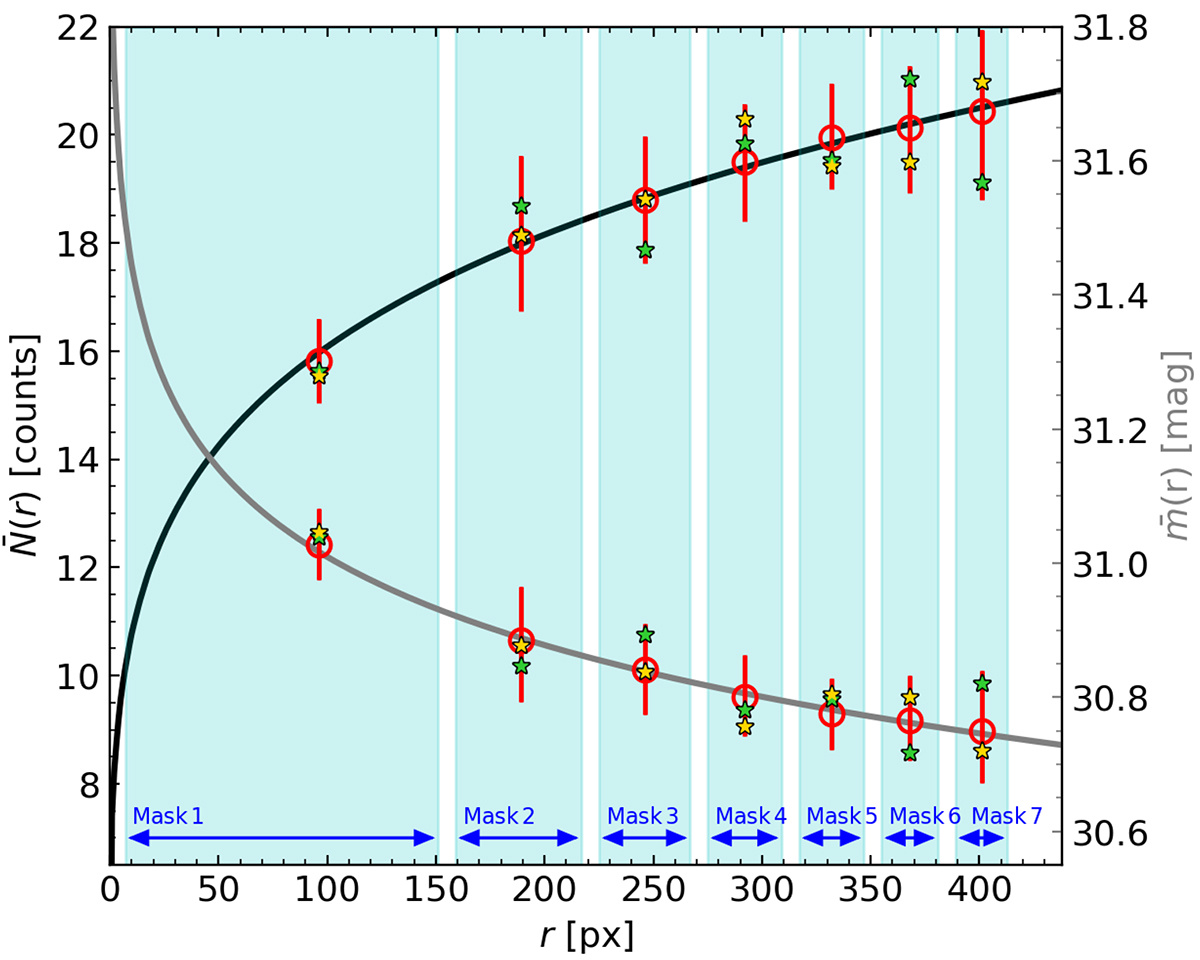
Fig. 13.
Download original image
Variable SBF radial profile shown in counts as a black line and in magnitudes as a grey line. Annular masks are indicated as cyan vertical regions. For each mask, the SBF mean fitting results over 50 simulations are marked as red dots, as well as its error bar. Results at each mask of two different example galaxies (retrieved from the 50 simulations) are shown with green and yellow star markers.
Current usage metrics show cumulative count of Article Views (full-text article views including HTML views, PDF and ePub downloads, according to the available data) and Abstracts Views on Vision4Press platform.
Data correspond to usage on the plateform after 2015. The current usage metrics is available 48-96 hours after online publication and is updated daily on week days.
Initial download of the metrics may take a while.