Fig. 12.
Download original image
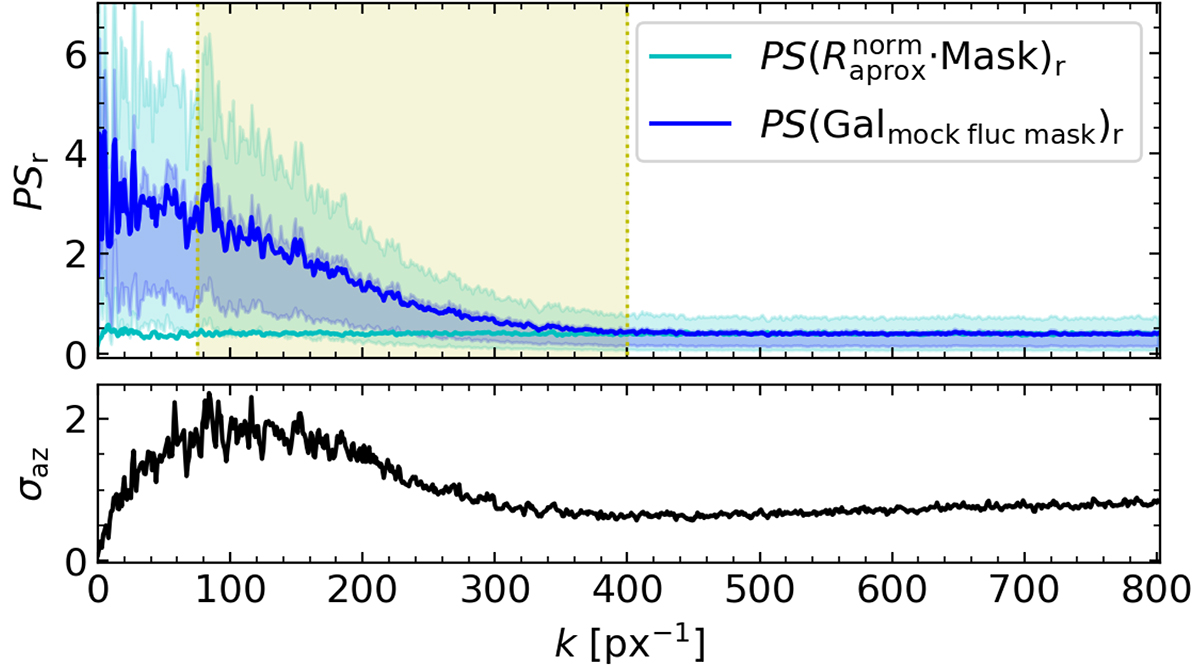
Power spectrum (not rescaled) similar to the one of Fig. 4, using the same data and mask. Top panel: blue line as the radial power spectrum of the observed fluctuation, PS(Galmock fluc mask)r, with a scatter associated with the distribution of values found at each radius (lower 16% and higher 84% percentiles in pale-blue and lower 32% and higher 68% in pale-cyan); cyan line as the radial power spectrum of the masked instrumental noise term, ![]() ; the range of frequencies where the fitting is performed (kfit, i = 75 px−1, kfit, f = 400 px−1) is marked with a pale-yellow vertical region. Bottom panel: standard deviation associated with the azimuthal average (σaz).
; the range of frequencies where the fitting is performed (kfit, i = 75 px−1, kfit, f = 400 px−1) is marked with a pale-yellow vertical region. Bottom panel: standard deviation associated with the azimuthal average (σaz).
Current usage metrics show cumulative count of Article Views (full-text article views including HTML views, PDF and ePub downloads, according to the available data) and Abstracts Views on Vision4Press platform.
Data correspond to usage on the plateform after 2015. The current usage metrics is available 48-96 hours after online publication and is updated daily on week days.
Initial download of the metrics may take a while.