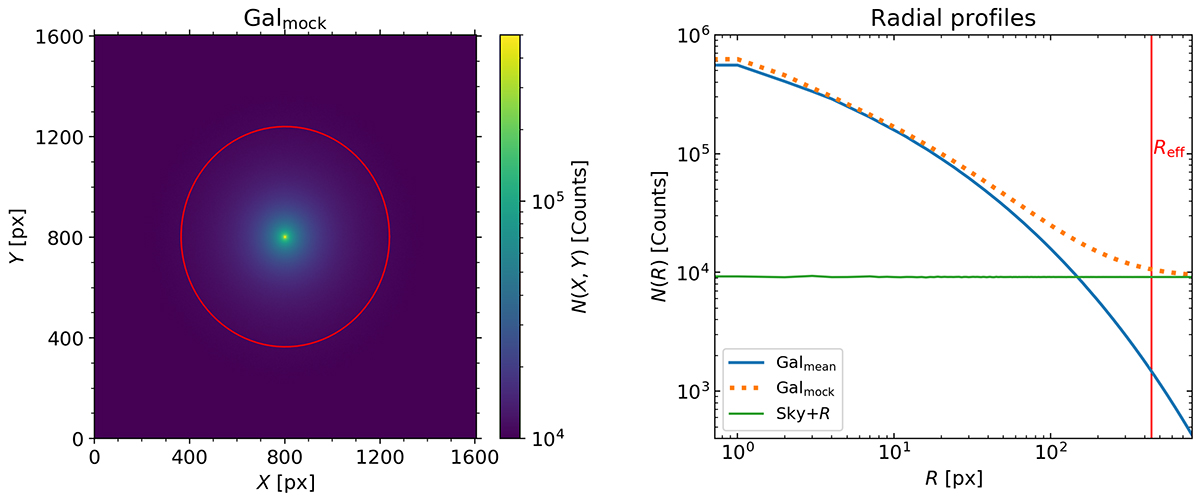
Fig. 1.
Download original image
Representation of our models computed with the data presented in Sect. 2.1. Left: image of the mock galaxy model (Galmock). Right: radial profiles of the mean model (Galmean) as a blue solid line, the mock model (Galmock) as an orange dotted line, and the sky background with the instrumental noise as a solid green line. The effective radius Reff is shown as a red circumference (left) and a vertical line (right).
Current usage metrics show cumulative count of Article Views (full-text article views including HTML views, PDF and ePub downloads, according to the available data) and Abstracts Views on Vision4Press platform.
Data correspond to usage on the plateform after 2015. The current usage metrics is available 48-96 hours after online publication and is updated daily on week days.
Initial download of the metrics may take a while.