Fig. 4
Download original image
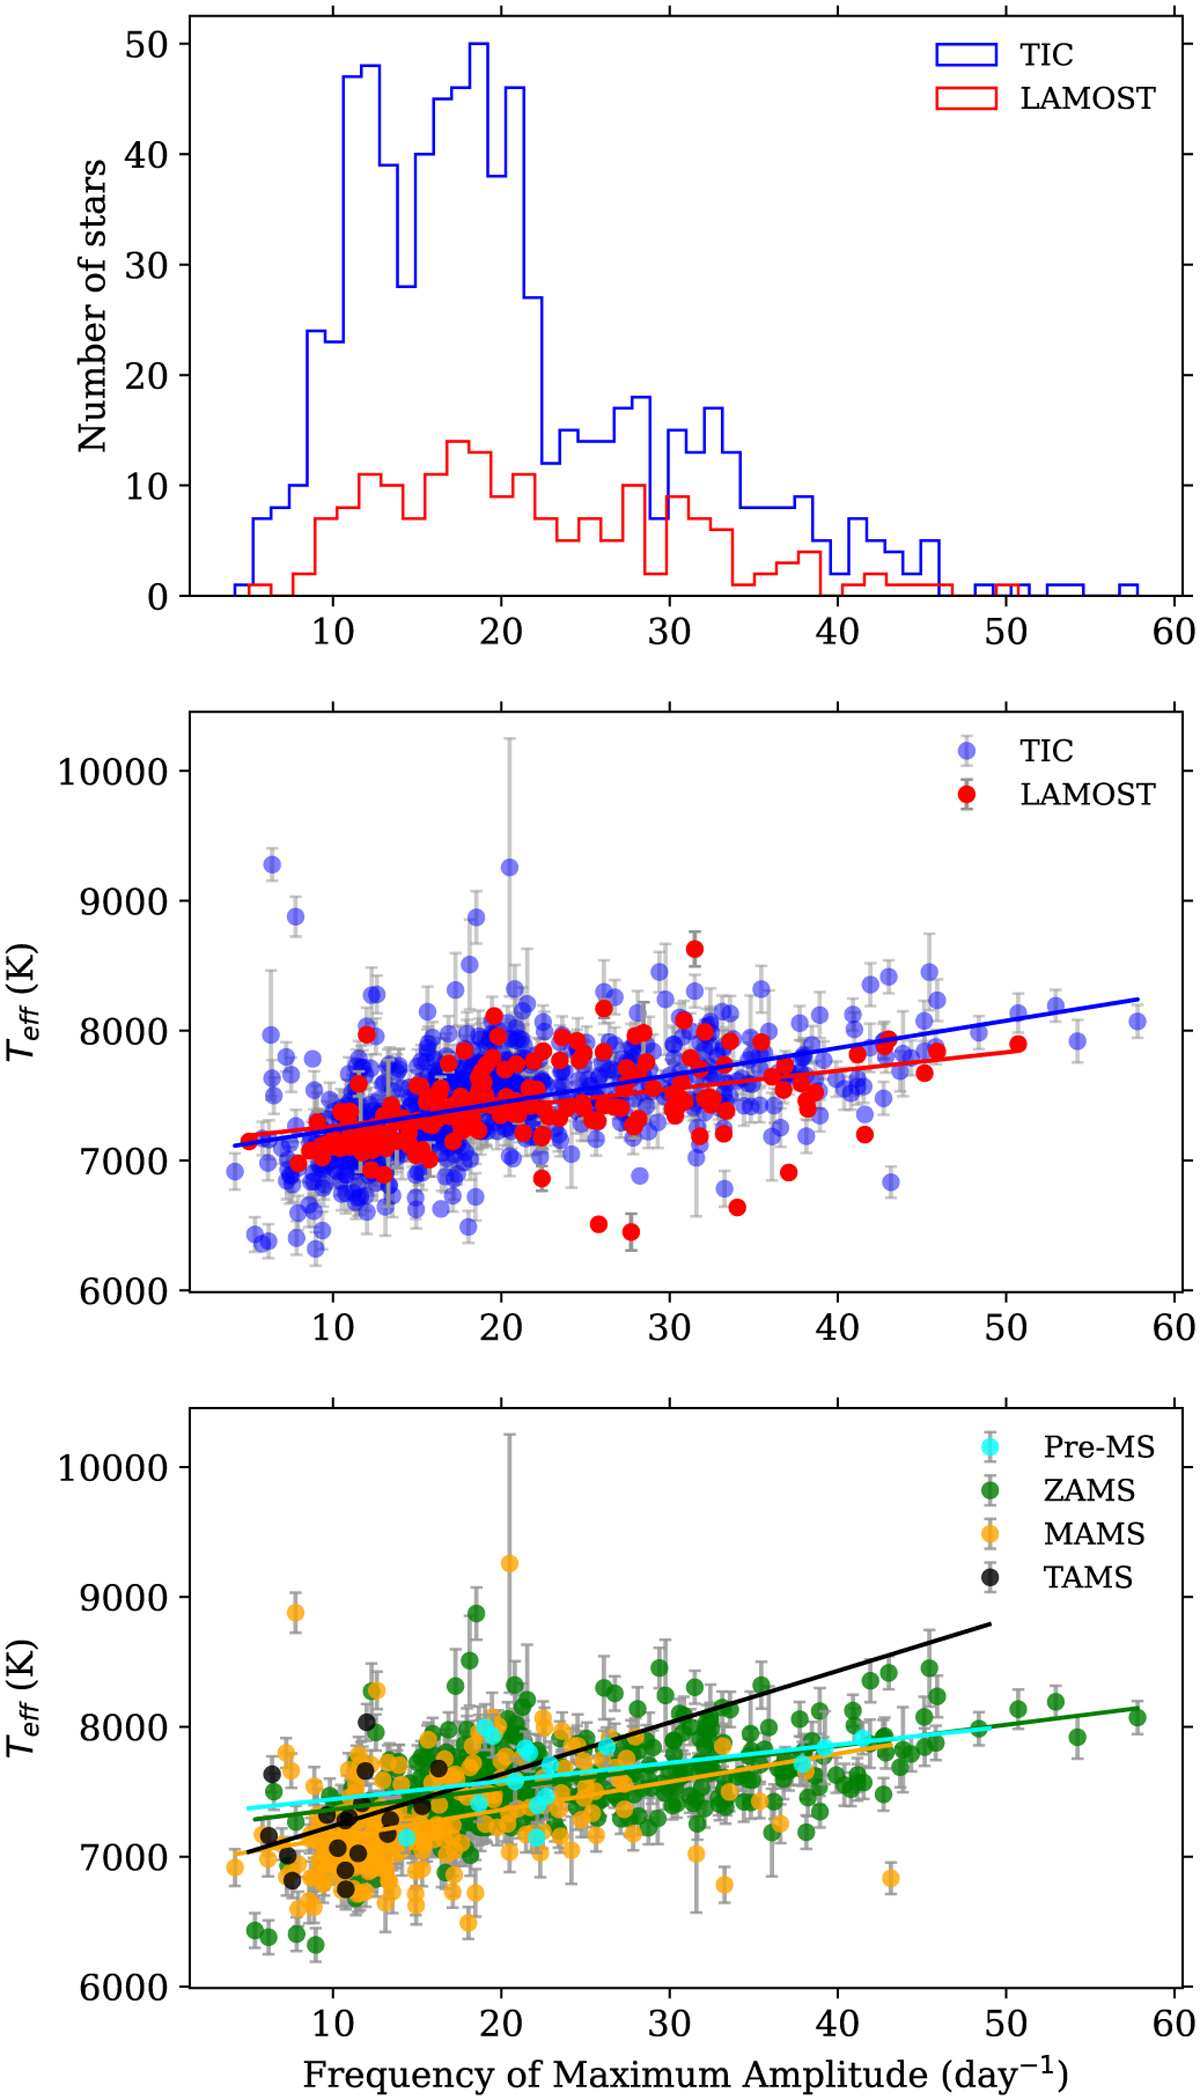
Relationship between pulsation frequency and temperature was investigated for both TIC and LAMOST samples. Top row shows distribution of frequency with maximum amplitude (shown as a blue region) for the ensemble of our 765 δ Scuti stars observed by TESS. The red region indicates the distribution for the subgroup of stars with spectro-scopic parameters from LAMOST. The middle row shows the frequency of the maximum amplitude plotted against the effective temperature, with the TIC and LAMOST parameters represented by blue and red dots, respectively. The statistically significant linear regressions are displayed as solid lines. The bottom row shows the same relationship as the middle row, dividing the stars into four groups of TIC stars according to surface gravity with log g ≥ 4.0 representing ZAMS, 3.5 ≤ log g < 4.0 representing the mid-age main sequence (MAMS), and log g < 3.5 representing the terminal age main sequence (TAMS), as well as Pre-MS stars matched to the literature.
Current usage metrics show cumulative count of Article Views (full-text article views including HTML views, PDF and ePub downloads, according to the available data) and Abstracts Views on Vision4Press platform.
Data correspond to usage on the plateform after 2015. The current usage metrics is available 48-96 hours after online publication and is updated daily on week days.
Initial download of the metrics may take a while.