Fig. 10

Download original image
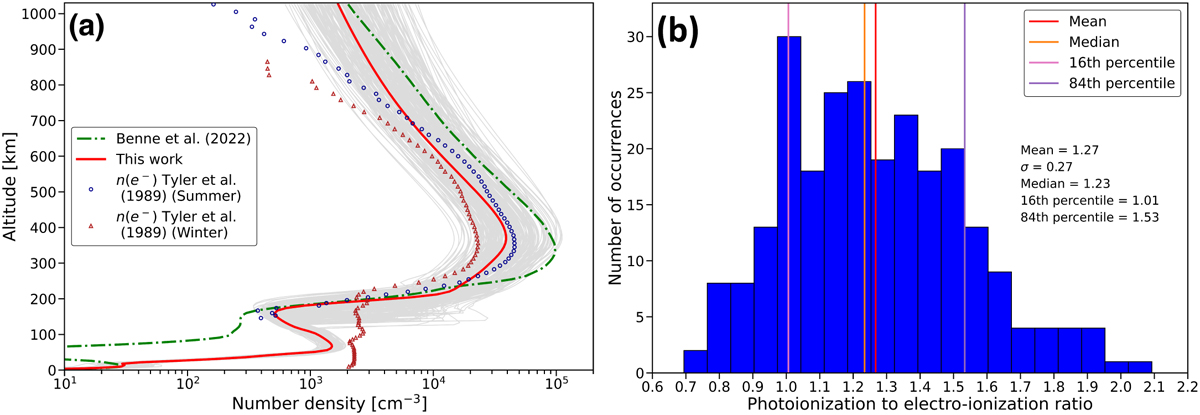
Results from this work about the electron density and ionization processes, (a) Nominal electron density profiles from Benne et al. (2022) (dash-dotted green line, using the electron production profile presented in Fig. 8 and not TRANSPlanets) and from this work (red, using TRANSPlanets to compute the electron-impact ionization and electron-impact dissociation rates). The red triangles and blue circles give the electron density profiles measured by Voyager 2 at the winter and summer occultation points, respectively (data from Tyler et al. 1989). The gray profiles are the 250 electron profiles obtained from this work with the Monte Carlo procedure, (b) Histogram of the ratio of photoionization to electron-impact ionization obtained from the 250 runs of the Monte Carlo procedure.
Current usage metrics show cumulative count of Article Views (full-text article views including HTML views, PDF and ePub downloads, according to the available data) and Abstracts Views on Vision4Press platform.
Data correspond to usage on the plateform after 2015. The current usage metrics is available 48-96 hours after online publication and is updated daily on week days.
Initial download of the metrics may take a while.


