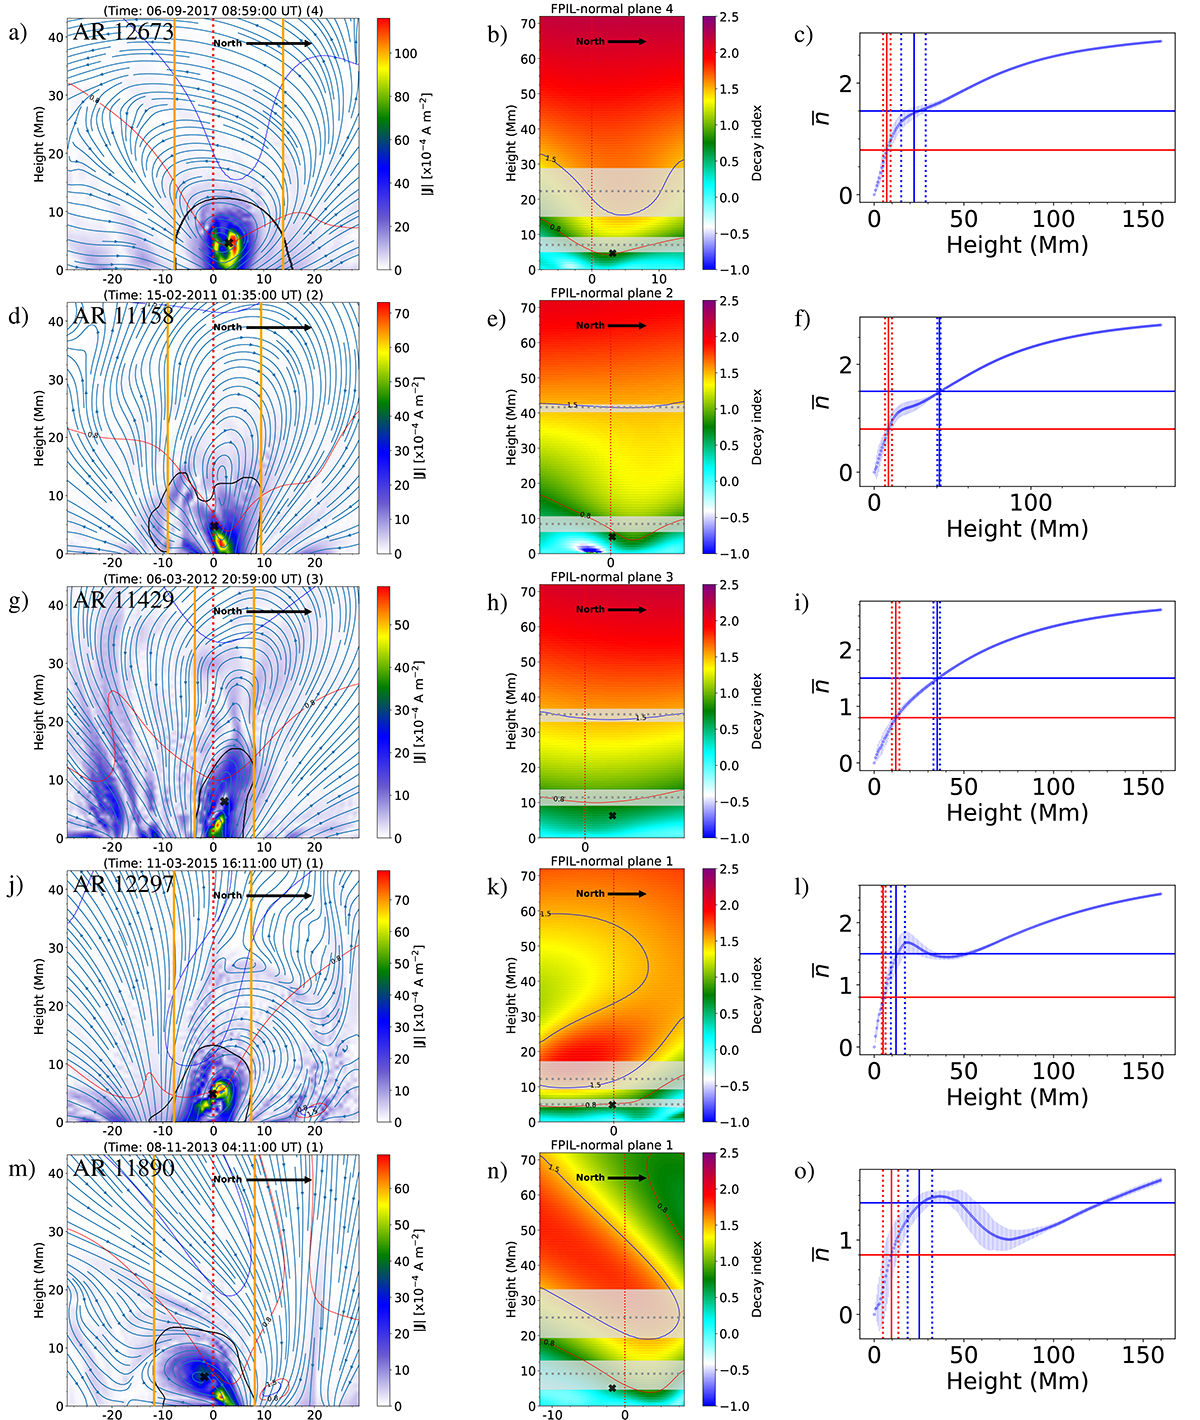
Fig. A.4.
Download original image
Left column: In-plane distribution of the electric current density (color-coded) and magnetic field (blue stream lines) in selected FPIL-normal planes. Closed black contours mark the regions with the strongest electric current (95th percentile of the current density in plane), used to locate the current-weighted center of MFR (SA) (black cross). The vertical dotted red line marks the location of the FPIL. Vertical orange lines mark the extent within the FPIL-normal plane within which the decay index was analyzed. Blue (red) contours indicate where n exceeds 1.5 (0.8). Middle column: Decay index on selected FPIL-normal planes covering the FOV indicated by vertical orange lines in the respective panels of the left column. The dotted gray line and shaded region indicates ![]() (using ncrit = 1.5 and ncrit = 0.8) and the corresponding spread when averaged over all considered FPIL-normal planes. The layout is the same as in the left column of Fig. A.2. Right column:
(using ncrit = 1.5 and ncrit = 0.8) and the corresponding spread when averaged over all considered FPIL-normal planes. The layout is the same as in the left column of Fig. A.2. Right column:
![]() vs. height profiles derived from all of the FPIL-normal planes (their footprints are indicated in the respective panels of Fig. A.1). The layout is the same as in the right column of Fig. A.2.
vs. height profiles derived from all of the FPIL-normal planes (their footprints are indicated in the respective panels of Fig. A.1). The layout is the same as in the right column of Fig. A.2.
Current usage metrics show cumulative count of Article Views (full-text article views including HTML views, PDF and ePub downloads, according to the available data) and Abstracts Views on Vision4Press platform.
Data correspond to usage on the plateform after 2015. The current usage metrics is available 48-96 hours after online publication and is updated daily on week days.
Initial download of the metrics may take a while.