Fig. A.2.
Download original image
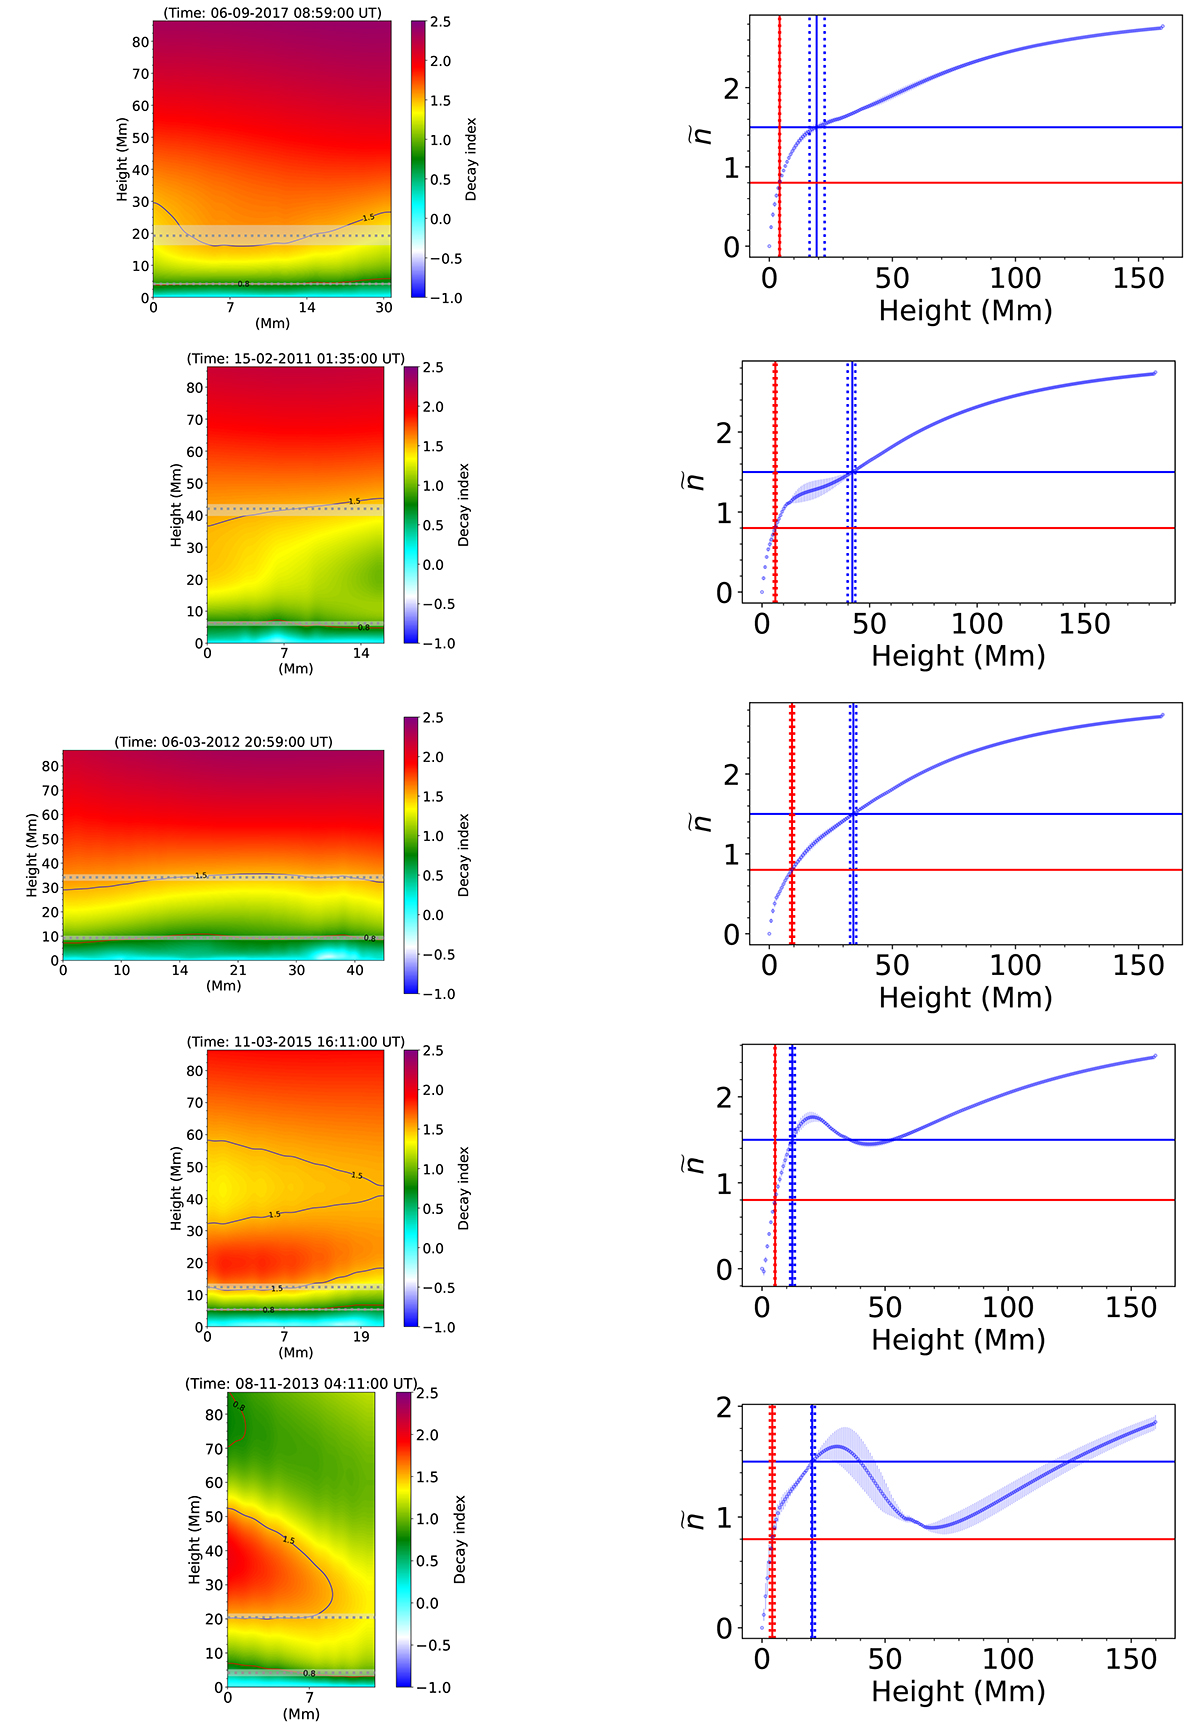
Left column: Distribution of the decay index in the FPIL-aligned planes. The blue and red curves indicate where n exceeds 1.5 and 0.8, respectively. Dotted gray lines indicate the correspondingly estimated critical height of the TI. Shaded areas mark the corresponding uncertainties. Right column: Profile of ![]() vs. height. The horizontal blue (red) lines indicate where
vs. height. The horizontal blue (red) lines indicate where ![]() = 1.5 (0.8), respectively. Vertical solid (dotted) blue lines mark the heights at which
= 1.5 (0.8), respectively. Vertical solid (dotted) blue lines mark the heights at which ![]() ± 1 MAD = 1.5. Vertical solid (dotted) red lines mark the heights at which
± 1 MAD = 1.5. Vertical solid (dotted) red lines mark the heights at which ![]() ± 1 MAD = 0.8.
± 1 MAD = 0.8.
Current usage metrics show cumulative count of Article Views (full-text article views including HTML views, PDF and ePub downloads, according to the available data) and Abstracts Views on Vision4Press platform.
Data correspond to usage on the plateform after 2015. The current usage metrics is available 48-96 hours after online publication and is updated daily on week days.
Initial download of the metrics may take a while.