Fig. 2.
Download original image
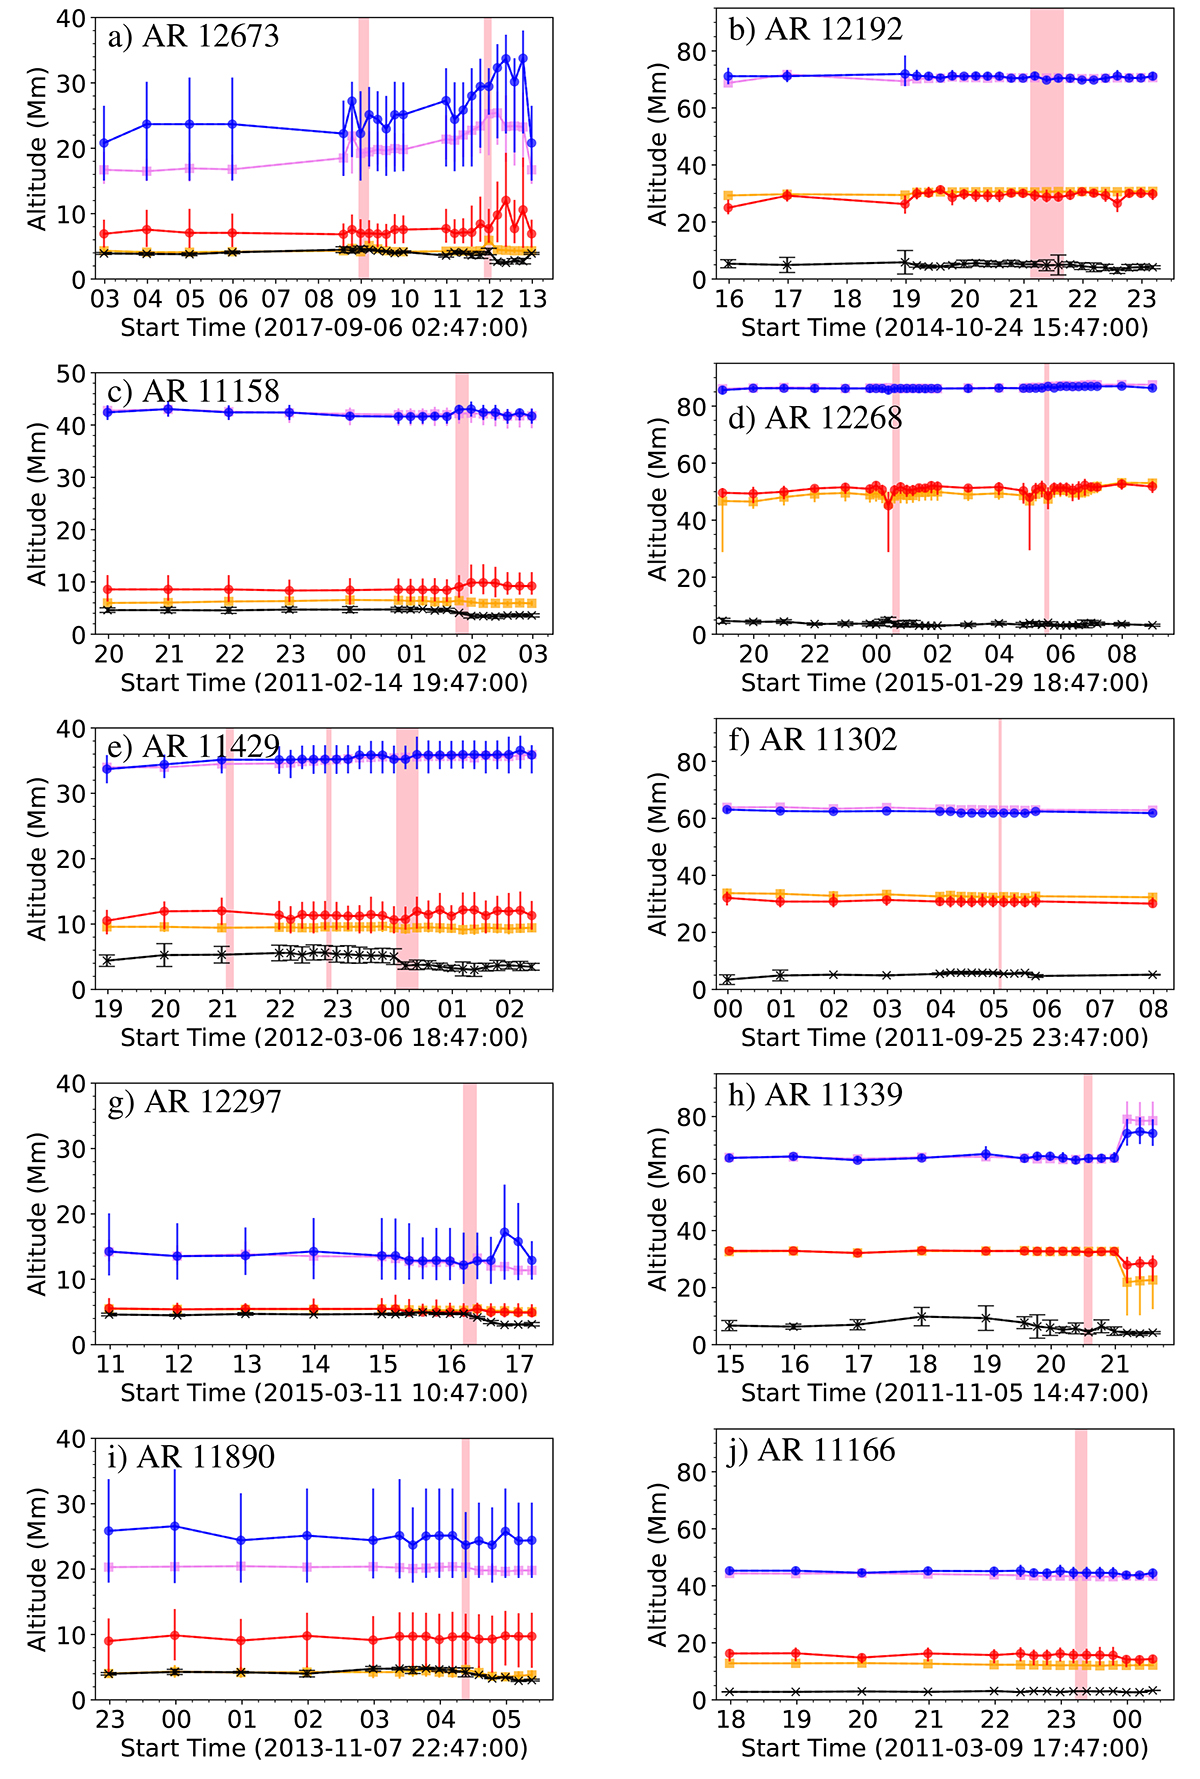
Time evolution of critical heights for TI, ![]() and
and ![]() (using two different values for ncrit), as well as the center (
(using two different values for ncrit), as well as the center (![]() ) heights around the five eruptive (left column) and five confined (right column) flares under study. The solid black lines connecting crosses mark the values of
) heights around the five eruptive (left column) and five confined (right column) flares under study. The solid black lines connecting crosses mark the values of ![]() . Blue and red lines represent
. Blue and red lines represent ![]() when ncrit = 1.5 or ncrit = 0.8, respectively, was used as a threshold for TI, computed from the FPIL-normal planes. Violet and orange lines, respectively, show
when ncrit = 1.5 or ncrit = 0.8, respectively, was used as a threshold for TI, computed from the FPIL-normal planes. Violet and orange lines, respectively, show ![]() computed from the FPIL-aligned planes. Vertical bars mark the corresponding uncertainty.
computed from the FPIL-aligned planes. Vertical bars mark the corresponding uncertainty.
Current usage metrics show cumulative count of Article Views (full-text article views including HTML views, PDF and ePub downloads, according to the available data) and Abstracts Views on Vision4Press platform.
Data correspond to usage on the plateform after 2015. The current usage metrics is available 48-96 hours after online publication and is updated daily on week days.
Initial download of the metrics may take a while.