Fig. 1.
Download original image
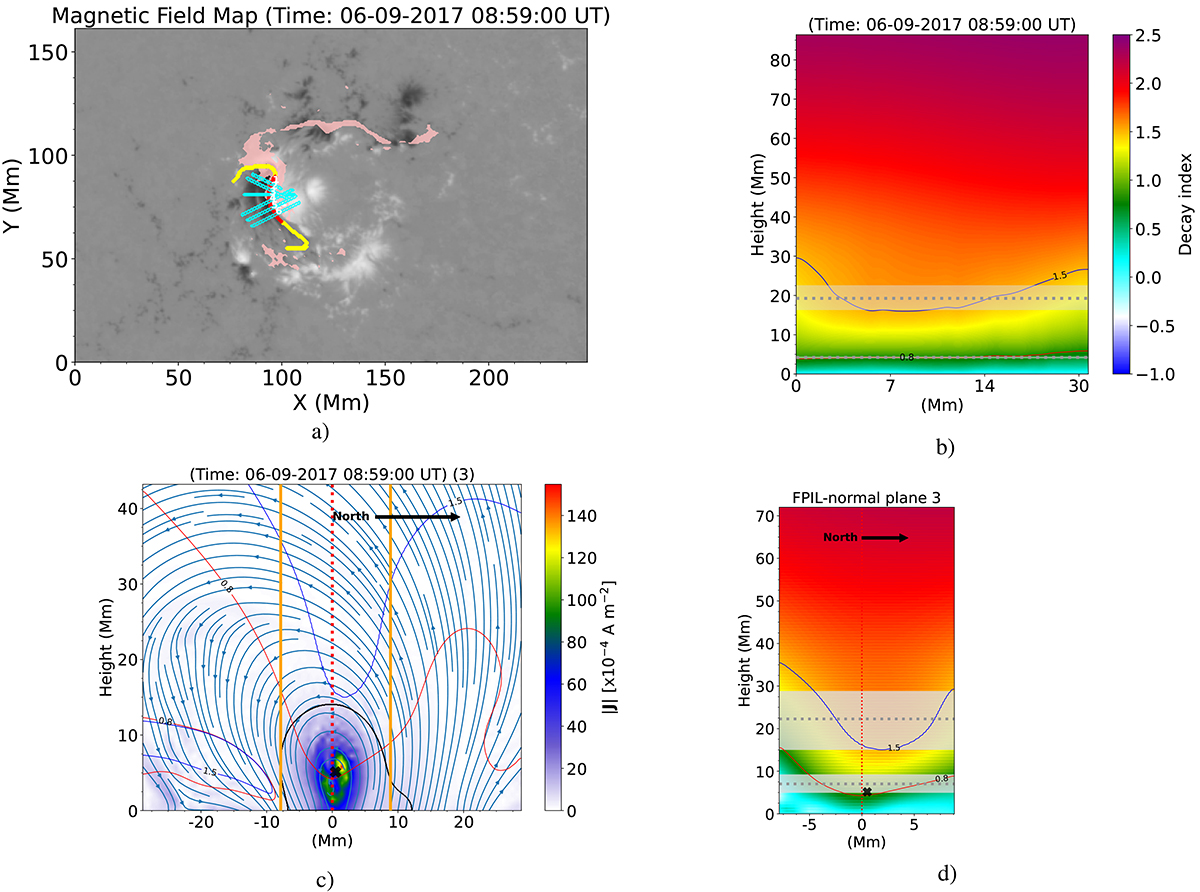
Ingredients in the stability analysis for the example of AR 12673 on September 6, 2017 at 08:59 UT. (a) Flare ribbon mask (pink) and central part of flare-relevant PIL (red) alongside the full detected FPIL of the AR (yellow curve). Cyan lines mark the footprint of the FPIL-normal planes used for further analysis. The grayscale background shows the vertical component of the photospheric magnetic field. Black and white colors denote negative and positive polarities, respectively. (b) Distribution of the decay index in the FPIL-aligned vertical plane (its footprint is shown in red in (a)). The dotted gray line indicates ![]() (using ncrit = 1.5 and ncrit = 0.8) and the shaded region marks the spread determined from the FPIL-aligned vertical plane. The blue (red) curve indicates the height at which the decay index is 1.5 (0.8). (c) Distribution of the electric current density (color-coded) and the magnetic field (blue arrows) projected into the FPIL-normal plane. The closed black contour marks the region with the strongest electric current (95th percentile of the unsigned total current density in the plane), used to locate the current-weighted center of the MFR (SA) (black cross). The dotted red line marks the location of the photospheric FPIL. The vertical orange lines indicate the extent of the FPIL plane in the horizontal direction that was considered in the decay index analysis. The blue and red curves that are bending downwards indicate the heights at which ncrit is 1.5 and 0.8, respectively. (d) Decay index within a selected portion (indicated by vertical orange lines in (c)) of the FPIL-normal plane. The dotted gray line indicates
(using ncrit = 1.5 and ncrit = 0.8) and the shaded region marks the spread determined from the FPIL-aligned vertical plane. The blue (red) curve indicates the height at which the decay index is 1.5 (0.8). (c) Distribution of the electric current density (color-coded) and the magnetic field (blue arrows) projected into the FPIL-normal plane. The closed black contour marks the region with the strongest electric current (95th percentile of the unsigned total current density in the plane), used to locate the current-weighted center of the MFR (SA) (black cross). The dotted red line marks the location of the photospheric FPIL. The vertical orange lines indicate the extent of the FPIL plane in the horizontal direction that was considered in the decay index analysis. The blue and red curves that are bending downwards indicate the heights at which ncrit is 1.5 and 0.8, respectively. (d) Decay index within a selected portion (indicated by vertical orange lines in (c)) of the FPIL-normal plane. The dotted gray line indicates ![]() (using ncrit = 1.5 and ncrit = 0.8) when averaged over all considered FPIL-normal planes. The gray-shaded region marks the corresponding spread of hcrit across all considered FPIL-normal planes. The black cross indicates the estimated height of the current-weighted center of the MFR (SA). The blue and red curves indicate the heights at which ncrit is 1.5 and 0.8, respectively.
(using ncrit = 1.5 and ncrit = 0.8) when averaged over all considered FPIL-normal planes. The gray-shaded region marks the corresponding spread of hcrit across all considered FPIL-normal planes. The black cross indicates the estimated height of the current-weighted center of the MFR (SA). The blue and red curves indicate the heights at which ncrit is 1.5 and 0.8, respectively.
Current usage metrics show cumulative count of Article Views (full-text article views including HTML views, PDF and ePub downloads, according to the available data) and Abstracts Views on Vision4Press platform.
Data correspond to usage on the plateform after 2015. The current usage metrics is available 48-96 hours after online publication and is updated daily on week days.
Initial download of the metrics may take a while.