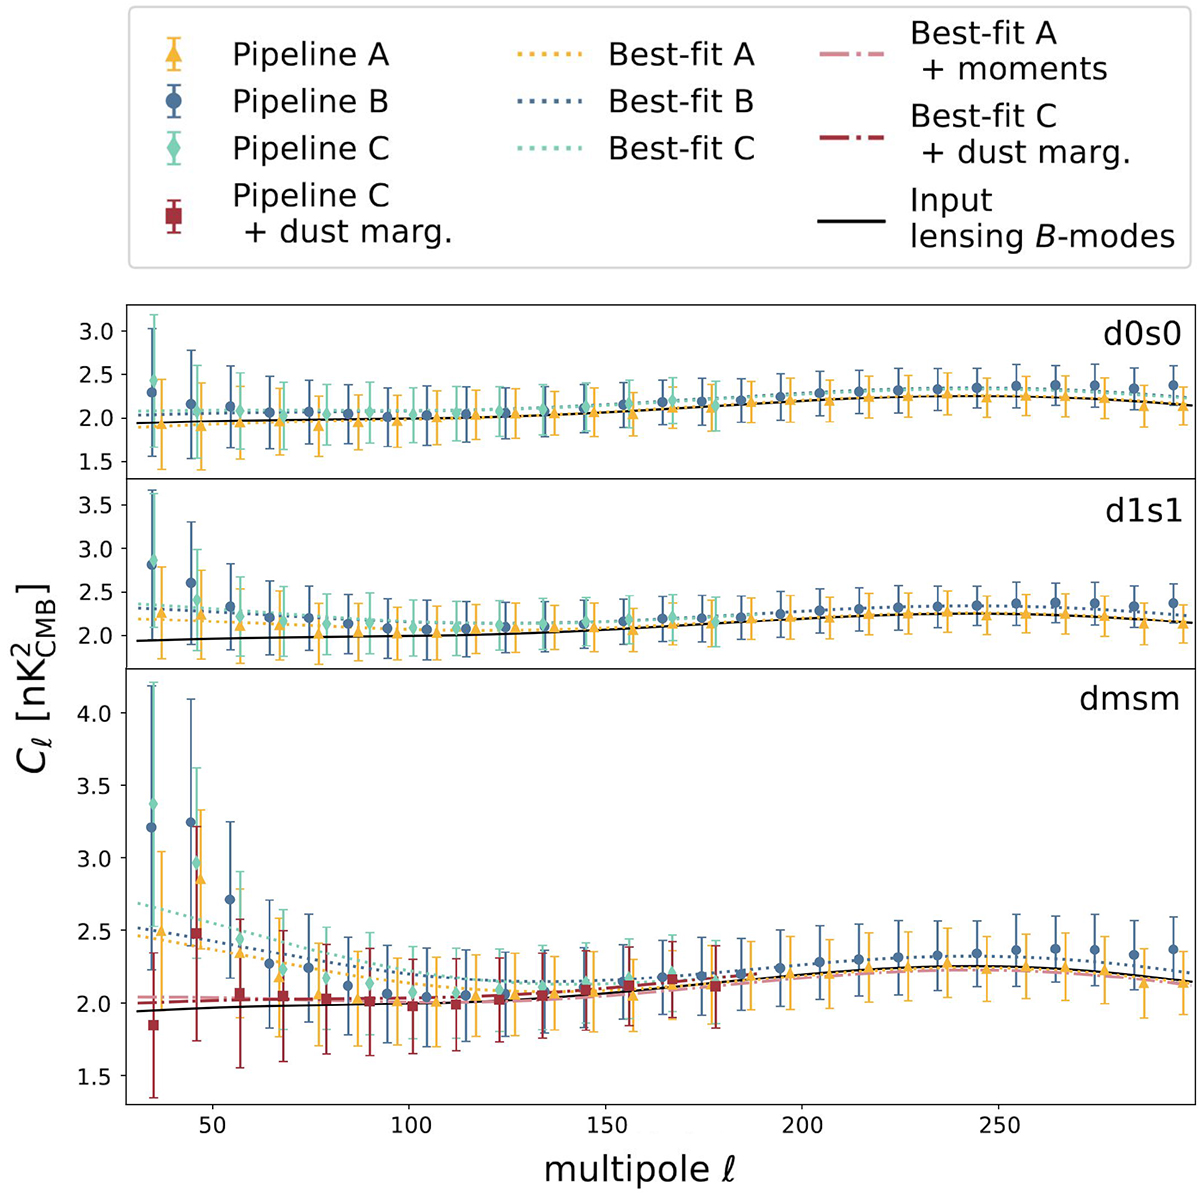
Fig. 7.
Download original image
CMB-only power spectra resulting from component separation with pipelines A, B, and C. We show non-Gaussian foregrounds scenarios d0s0 (top panel), d1s1 (middle panel), and dmsm (bottom panel) and consider the goal-optimistic noise scenario. The different colored markers with error bars show the mean of 500 simulations and the scatter between them (corresponding to the statistical uncertainties of a single realization). The dotted lines in the corresponding colors indicate the best-fit power spectrum model. In the dmsm case, we show the extended pipeline results from A + moments and C + dust marginalization with the best-fit models shown as dot-dashed lines. The black solid line is the input CMB model containing lensing B-modes only. We stress that pipeline C only considers multipoles up to ℓ = 180 in the power spectrum likelihood.
Current usage metrics show cumulative count of Article Views (full-text article views including HTML views, PDF and ePub downloads, according to the available data) and Abstracts Views on Vision4Press platform.
Data correspond to usage on the plateform after 2015. The current usage metrics is available 48-96 hours after online publication and is updated daily on week days.
Initial download of the metrics may take a while.