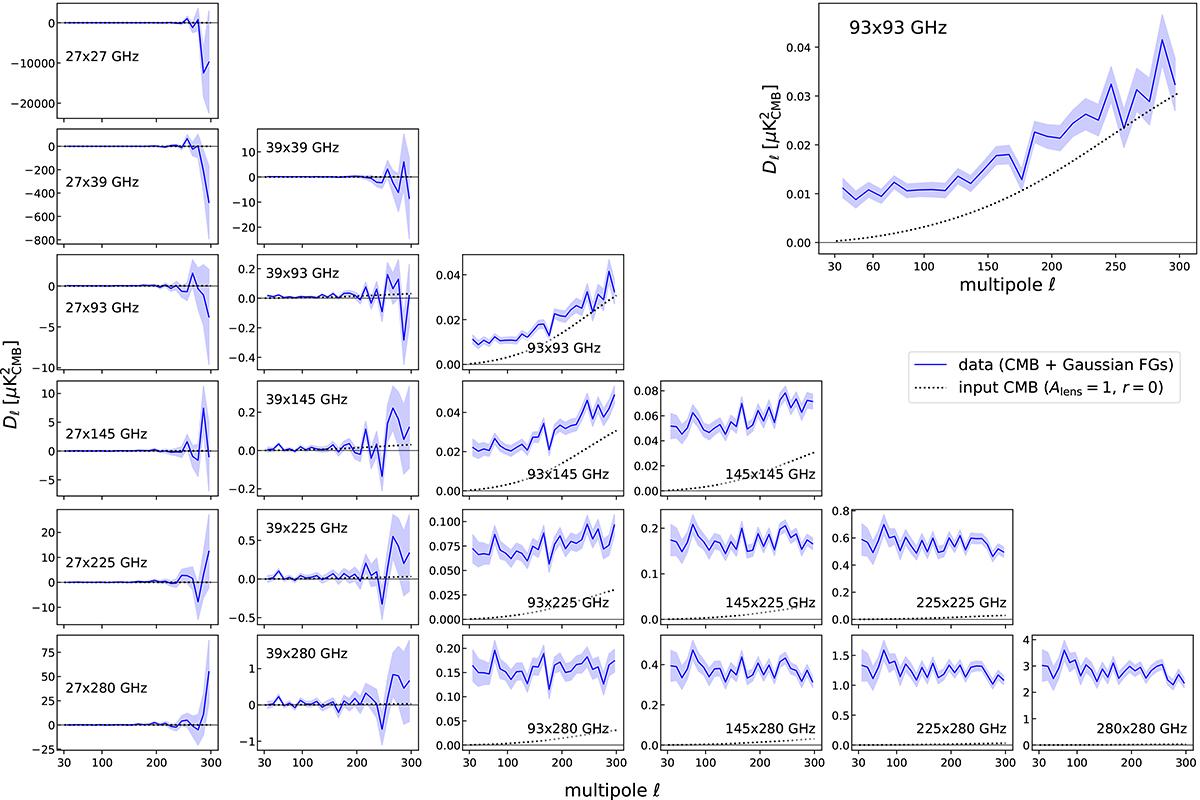
Fig. 3.
Download original image
Simulated power spectrum input data analyzed by pipeline A. We show a single realization of CMB and Gaussian foregrounds. Blue shaded areas quantify the 1σ Gaussian standard deviation calculated from simulations of CMB, noise, and Gaussian foregrounds. We note that negative auto-spectra can occur at noise-dominated scales as a result of cross-correlating data splits.
Current usage metrics show cumulative count of Article Views (full-text article views including HTML views, PDF and ePub downloads, according to the available data) and Abstracts Views on Vision4Press platform.
Data correspond to usage on the plateform after 2015. The current usage metrics is available 48-96 hours after online publication and is updated daily on week days.
Initial download of the metrics may take a while.