Fig. 10.
Download original image
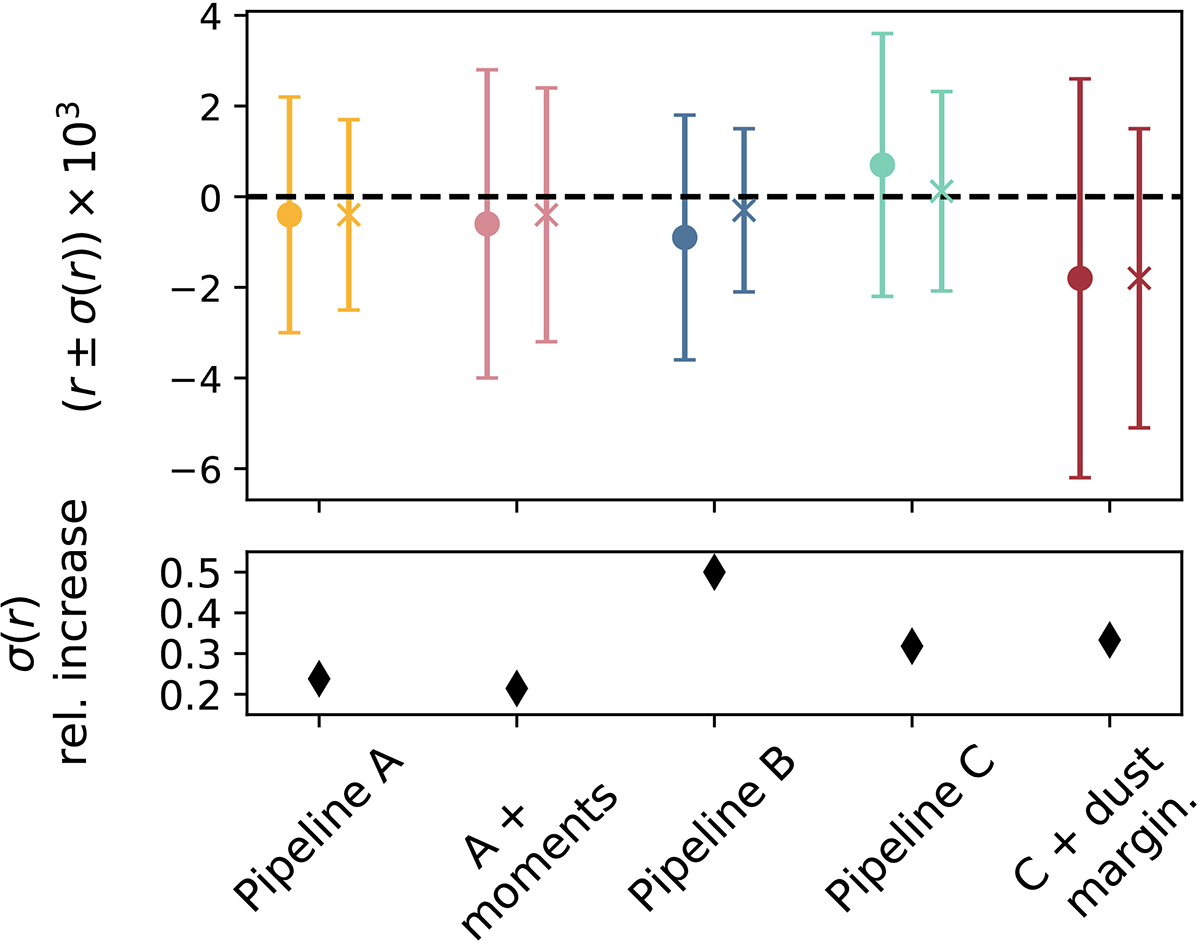
Mean r with (16, 84)% credible intervals from 500 simulations, applying the three nominal component separation pipelines plus extensions. We assume the d0s0 foreground scenario with baseline white noise level and optimistic 1/f component. Cross markers with smaller error bars correspond to homogeneous noise across the SAT field of view and dot markers with larger error bars correspond to inhomogeneous noise. The relative increase in σ(r) between both is shown in the bottom panel.
Current usage metrics show cumulative count of Article Views (full-text article views including HTML views, PDF and ePub downloads, according to the available data) and Abstracts Views on Vision4Press platform.
Data correspond to usage on the plateform after 2015. The current usage metrics is available 48-96 hours after online publication and is updated daily on week days.
Initial download of the metrics may take a while.