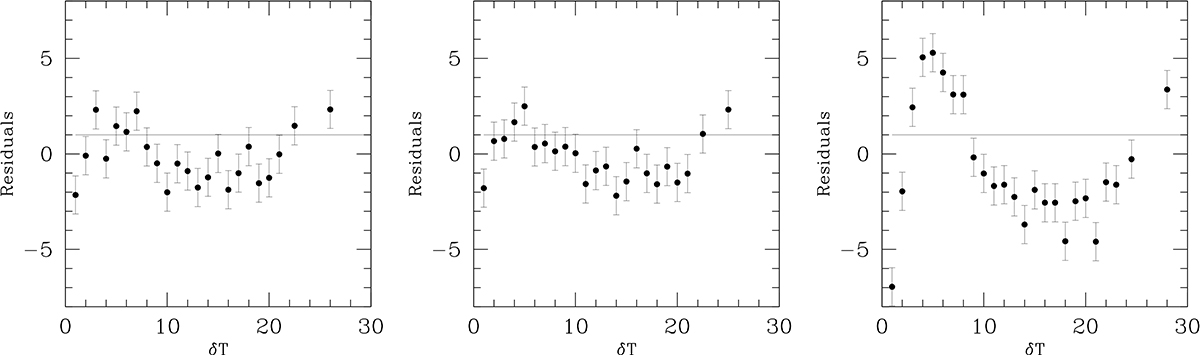
Fig. 8.
Download original image
Residuals after subtracting the best-fit exponential model from the cumulative distribution function of the waiting times δt between one avalanche and the next. The errors are calculated using Poisson statistics. From left to right, we show setups 1, 2, and 3. The residuals for setup 3 are quite large, indicating that in this case, the distribution function of δt is more complex than an exponential law. This indicates a correlated process.
Current usage metrics show cumulative count of Article Views (full-text article views including HTML views, PDF and ePub downloads, according to the available data) and Abstracts Views on Vision4Press platform.
Data correspond to usage on the plateform after 2015. The current usage metrics is available 48-96 hours after online publication and is updated daily on week days.
Initial download of the metrics may take a while.