Open Access
Fig. 2.
Download original image
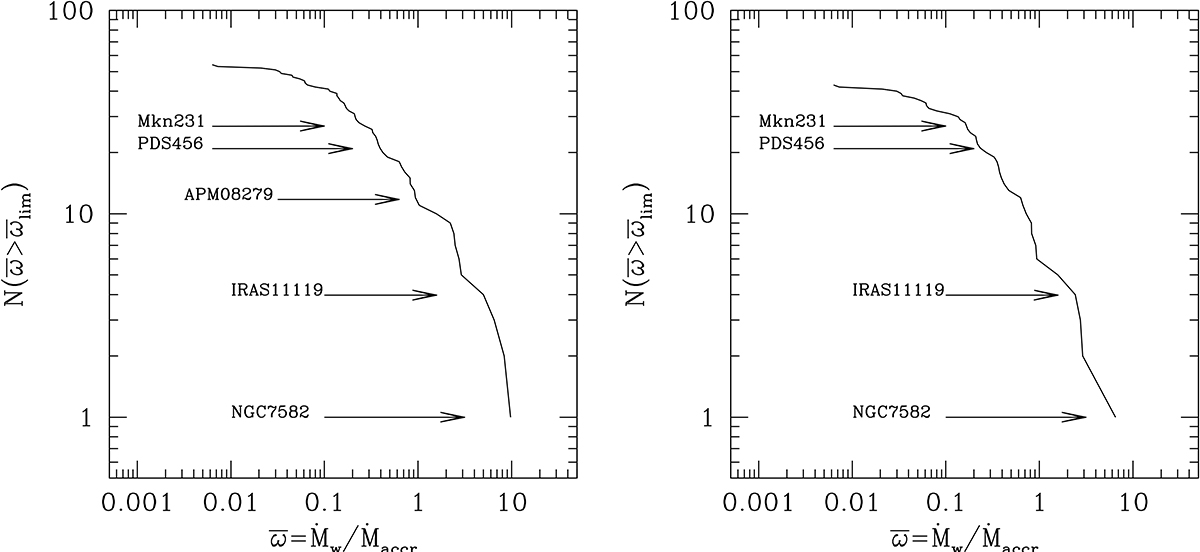
Cumulative distribution function of the number of systems in which ![]() exceeds a limit value. Left panel: 54 individual systems in 40 AGN. Right panel: 43 individual system in 34 sources at z < 0.3.
exceeds a limit value. Left panel: 54 individual systems in 40 AGN. Right panel: 43 individual system in 34 sources at z < 0.3.
Current usage metrics show cumulative count of Article Views (full-text article views including HTML views, PDF and ePub downloads, according to the available data) and Abstracts Views on Vision4Press platform.
Data correspond to usage on the plateform after 2015. The current usage metrics is available 48-96 hours after online publication and is updated daily on week days.
Initial download of the metrics may take a while.