Fig. 1.
Download original image
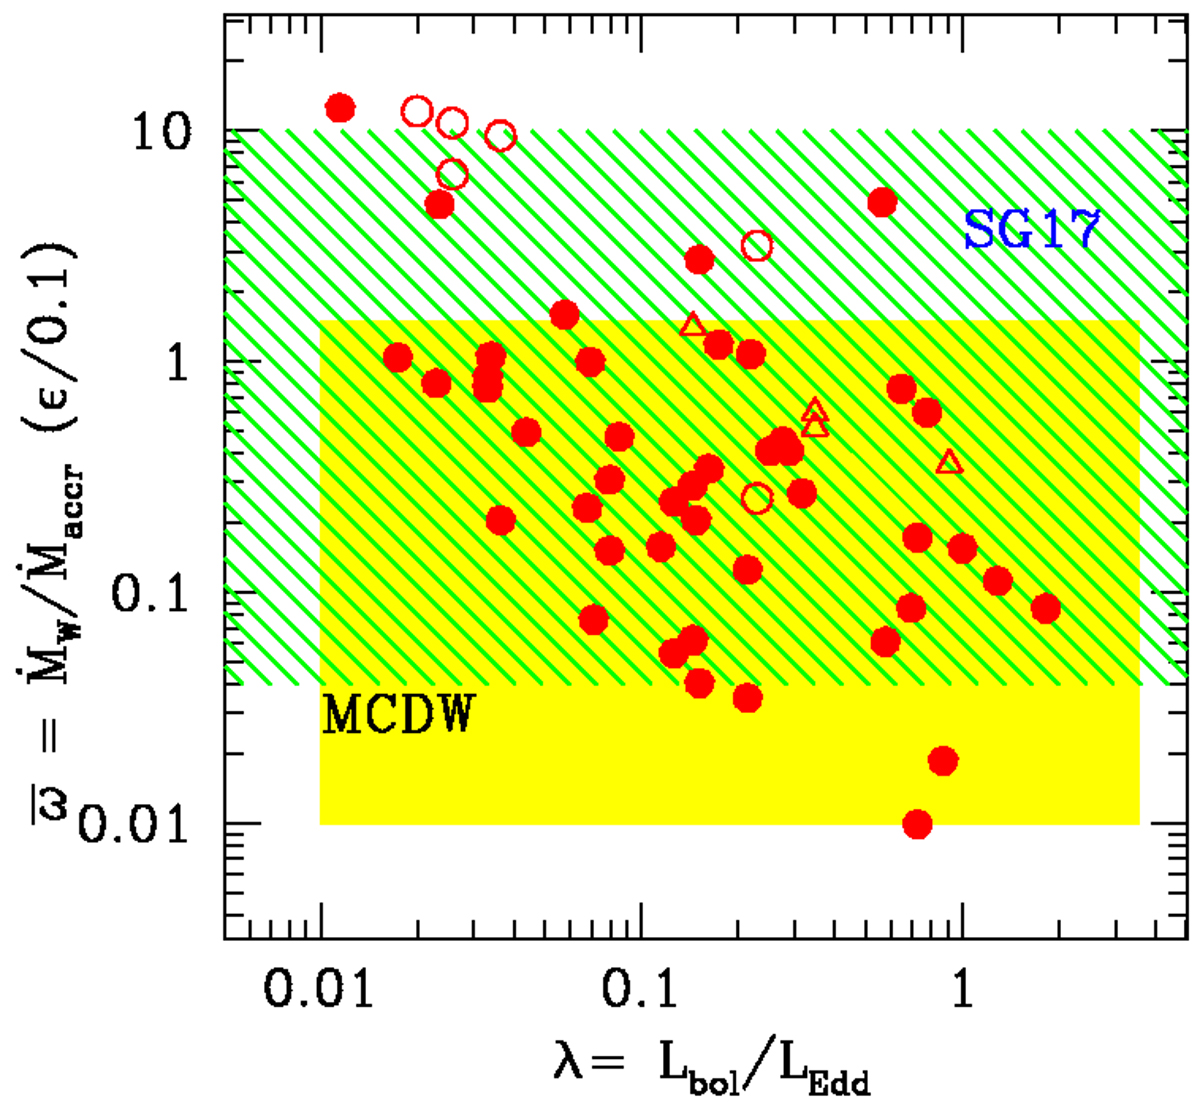
![]() vs. Eddington ratios for a sample of 54 UFO systems in 40 AGN. The filled circles represent z < 0.3 AGN, the open triangles show z > 0.3 AGN, and the open circles show lensed AGN. The shaded green area is the expectation of the Sadowski & Narayan (2016), SG17 and GS17 models, and the yellow area is the expectation of the analytic magneto-centrifugal model (e.g., Cui & Yuan 2020).
vs. Eddington ratios for a sample of 54 UFO systems in 40 AGN. The filled circles represent z < 0.3 AGN, the open triangles show z > 0.3 AGN, and the open circles show lensed AGN. The shaded green area is the expectation of the Sadowski & Narayan (2016), SG17 and GS17 models, and the yellow area is the expectation of the analytic magneto-centrifugal model (e.g., Cui & Yuan 2020).
Current usage metrics show cumulative count of Article Views (full-text article views including HTML views, PDF and ePub downloads, according to the available data) and Abstracts Views on Vision4Press platform.
Data correspond to usage on the plateform after 2015. The current usage metrics is available 48-96 hours after online publication and is updated daily on week days.
Initial download of the metrics may take a while.