Fig. 2.
Download original image
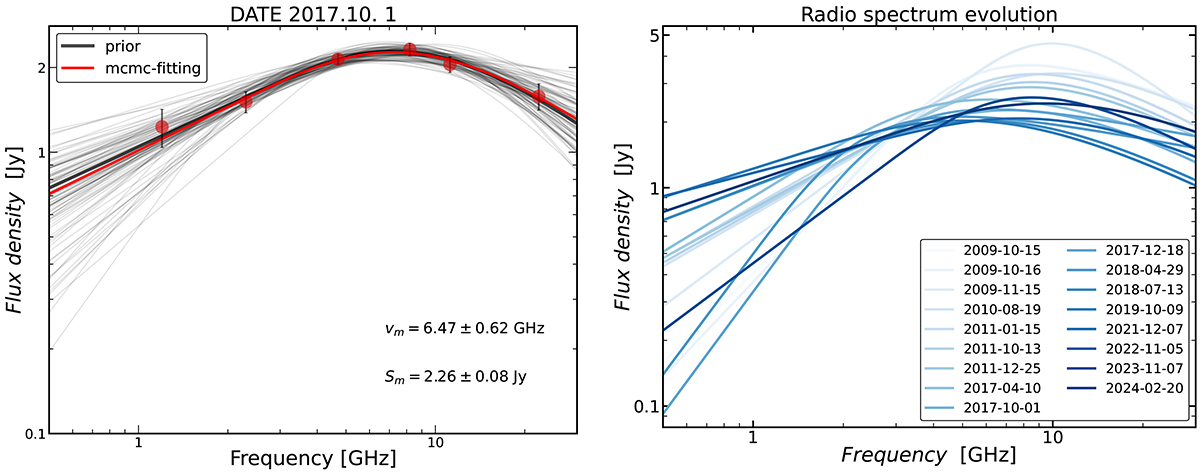
Examples of SAA model fit (left) and the evolution of the fitted spectra (right). In the left panel, the red, gray, and black lines denote the best mcmc-fitting result, along with 5000 sets of models randomly selected in the parameter space and the prior parameters, respectively. The right panel collected the fitted results of 17 epochs from 2009 to 2024, with darker lines representing more recent observations.
Current usage metrics show cumulative count of Article Views (full-text article views including HTML views, PDF and ePub downloads, according to the available data) and Abstracts Views on Vision4Press platform.
Data correspond to usage on the plateform after 2015. The current usage metrics is available 48-96 hours after online publication and is updated daily on week days.
Initial download of the metrics may take a while.