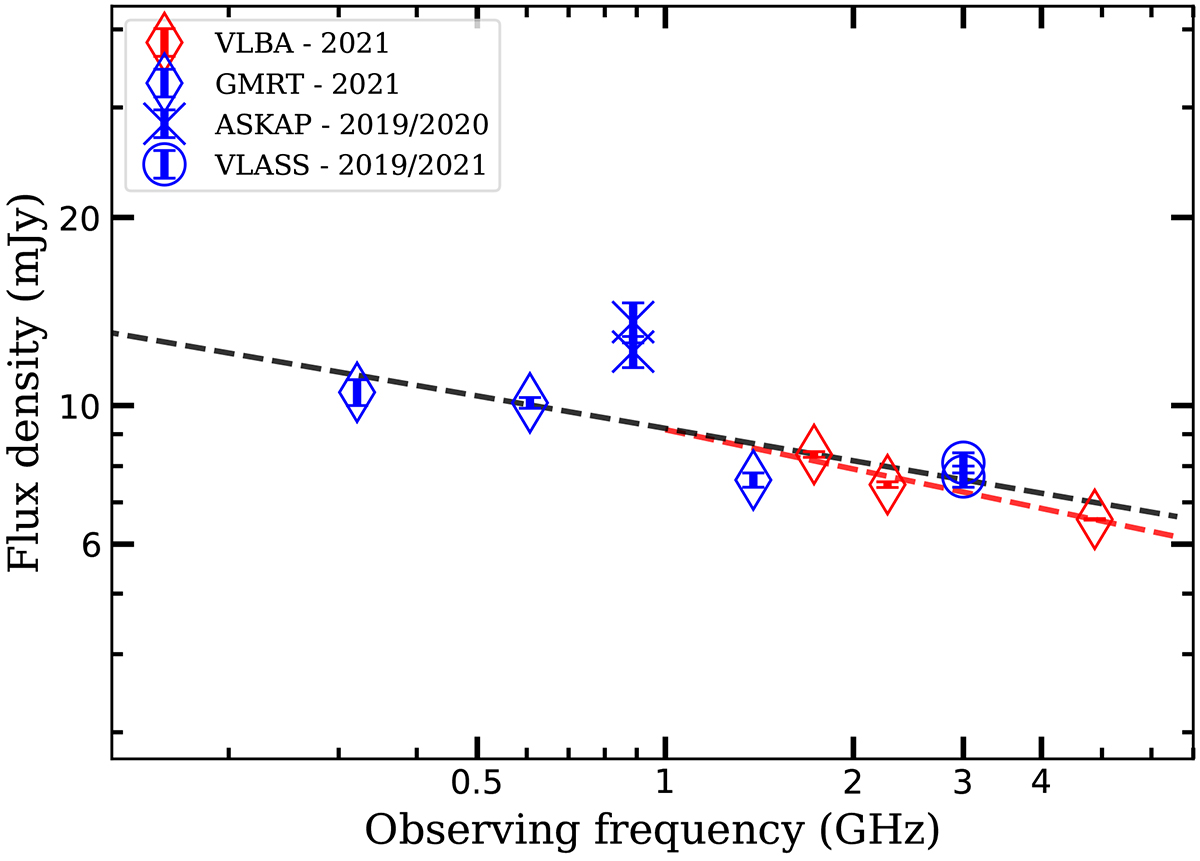
Fig. 2.
Download original image
Radio SED of J1702+1301, including data from our VLBA observation (red squares) as well as archive data from the GMRT, ASKAP, and VLASS surveys (blue labels). The best-fit results of VLBA observations are shown as the red line, with a spectral index of α = −0.21 ± 0.001. This spectrum is only slightly steeper than that found from previous results (black line) fitted from the synthesis imaging with much lower resolutions (An et al. 2023).
Current usage metrics show cumulative count of Article Views (full-text article views including HTML views, PDF and ePub downloads, according to the available data) and Abstracts Views on Vision4Press platform.
Data correspond to usage on the plateform after 2015. The current usage metrics is available 48-96 hours after online publication and is updated daily on week days.
Initial download of the metrics may take a while.