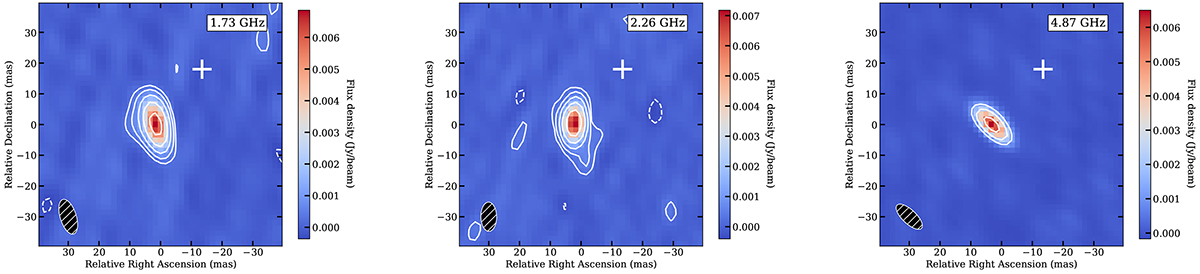
Fig. 1.
Download original image
VLBA radio continuum images of J1702+1301. The left, middle, and right panel shows the observations at 1.73 GHz, 2.36 GHz, and 4.87 GHz, respectively. The images are all centered at RA: 17h02m45.3119s, Dec: +13d01m02.222s, which is 22.3 mas southeast of the center measured from optical/X-ray observations and shown as a white cross. The contour levels are [−1, 1, 2, 4, 8, 16, 32, 64]*3σ, where σ corresponds to the rms noise level of each image. The synthesis beam for each image is shown in the lower-left corner.
Current usage metrics show cumulative count of Article Views (full-text article views including HTML views, PDF and ePub downloads, according to the available data) and Abstracts Views on Vision4Press platform.
Data correspond to usage on the plateform after 2015. The current usage metrics is available 48-96 hours after online publication and is updated daily on week days.
Initial download of the metrics may take a while.