Fig. 8.
Download original image
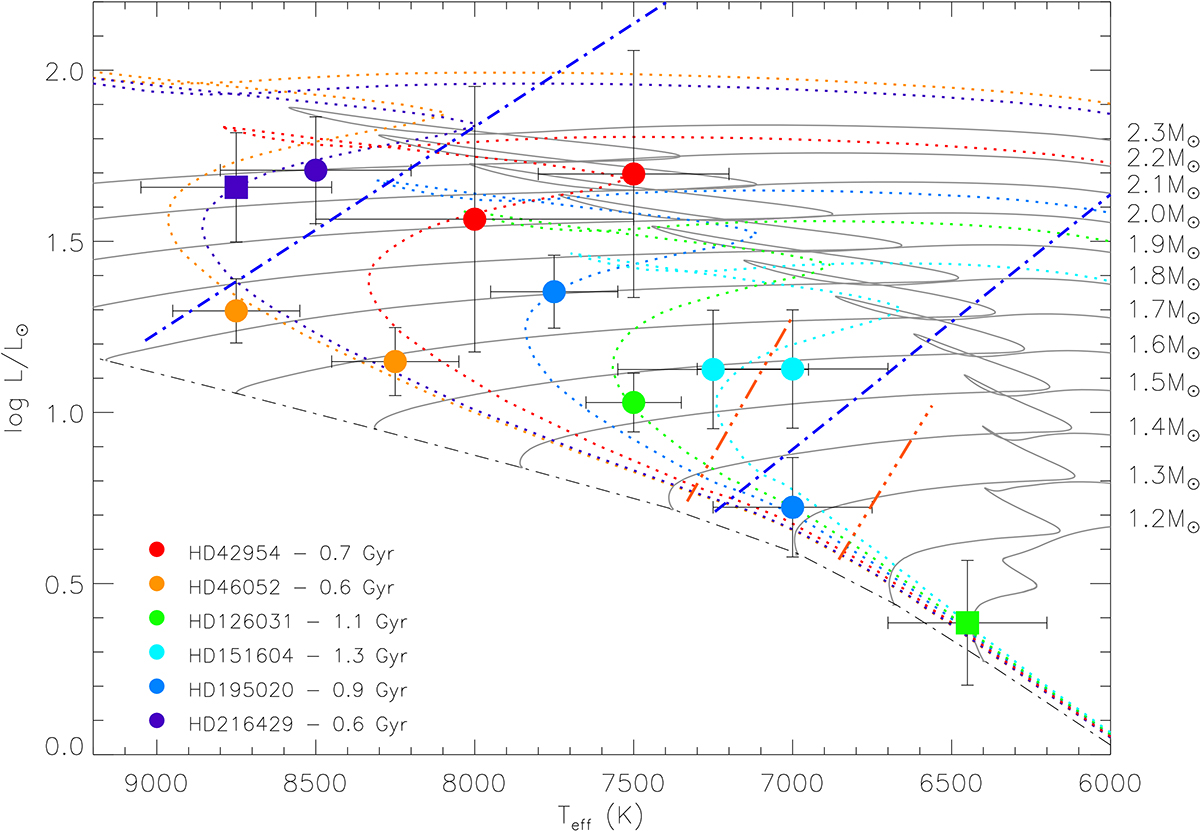
HR diagram for the six SB2 systems investigated in this paper. The colors differ according to the object. The evolutionary tracks (solid lines) of the labeled masses as well as the ZAMS (dash-dotted line), and the isochrones (dotted lines plotted with the same color as the reference system) for solar composition are displayed. The dash-dotted blue lines show the δ Sct instability strip of Breger & Pamyatnykh (1998). The orange dash-dotted lines show the theoretical edges of the γ Dor instability strip of Warner et al. (2003). The two stars plotted as filled squares have a standard solar composition.
Current usage metrics show cumulative count of Article Views (full-text article views including HTML views, PDF and ePub downloads, according to the available data) and Abstracts Views on Vision4Press platform.
Data correspond to usage on the plateform after 2015. The current usage metrics is available 48-96 hours after online publication and is updated daily on week days.
Initial download of the metrics may take a while.