Open Access
Fig. 6.
Download original image
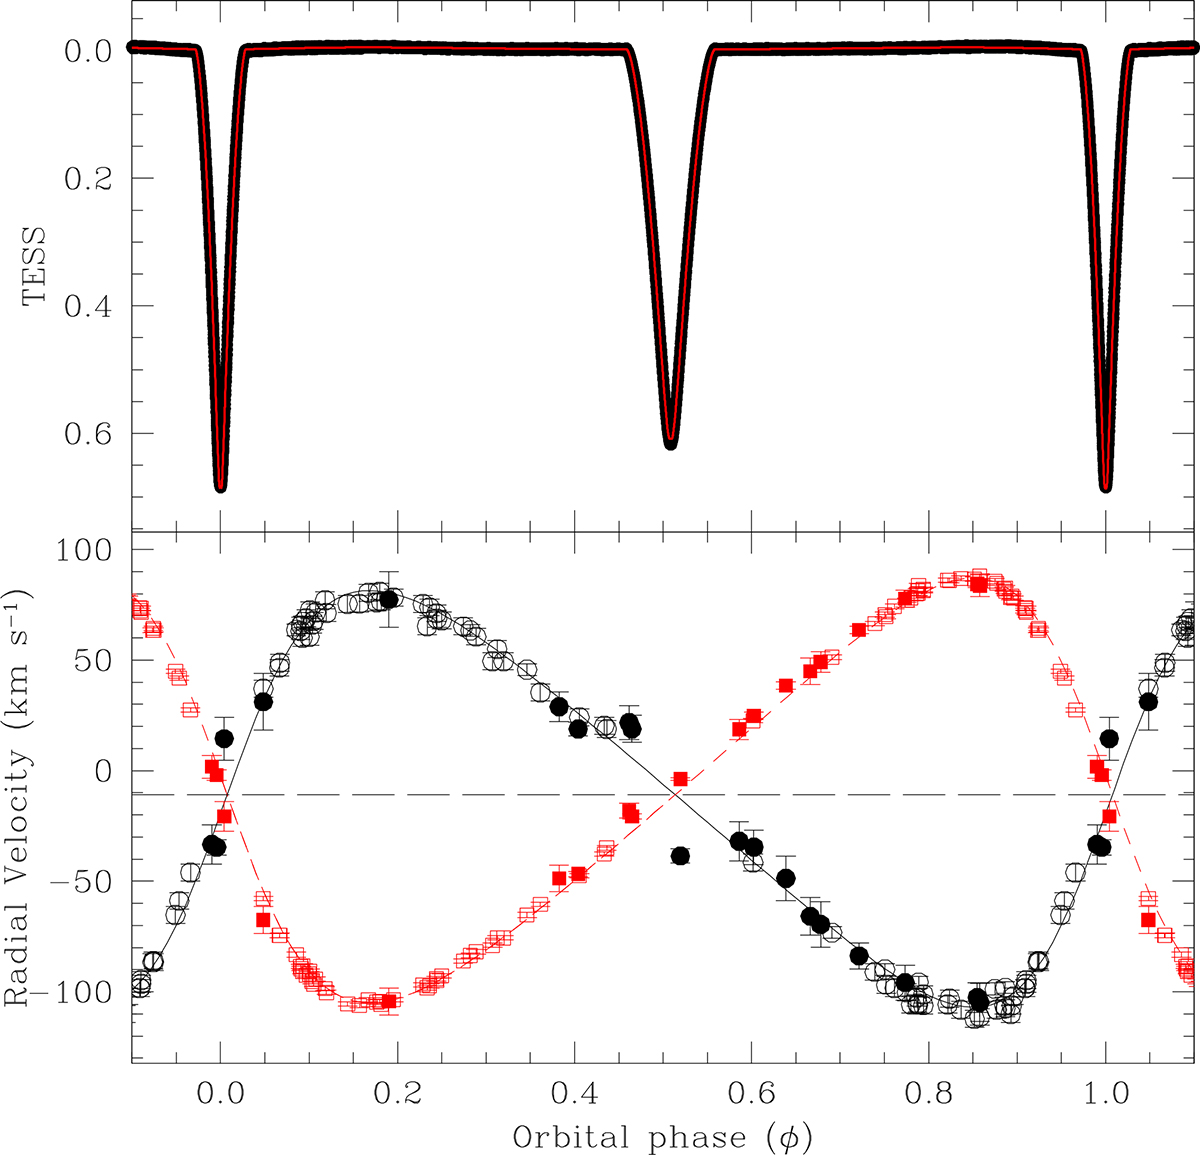
Light and RV curves of HD 216429. In the top panel, the red line is the model computed with JKTEBOP. In the bottom panel, symbols and colors are the same as in Fig. 1. Literature velocities are from Torres et al. (1999). The Rossiter-McLaughlin effect is clearly visible around ϕ ≈ 0.5.
Current usage metrics show cumulative count of Article Views (full-text article views including HTML views, PDF and ePub downloads, according to the available data) and Abstracts Views on Vision4Press platform.
Data correspond to usage on the plateform after 2015. The current usage metrics is available 48-96 hours after online publication and is updated daily on week days.
Initial download of the metrics may take a while.