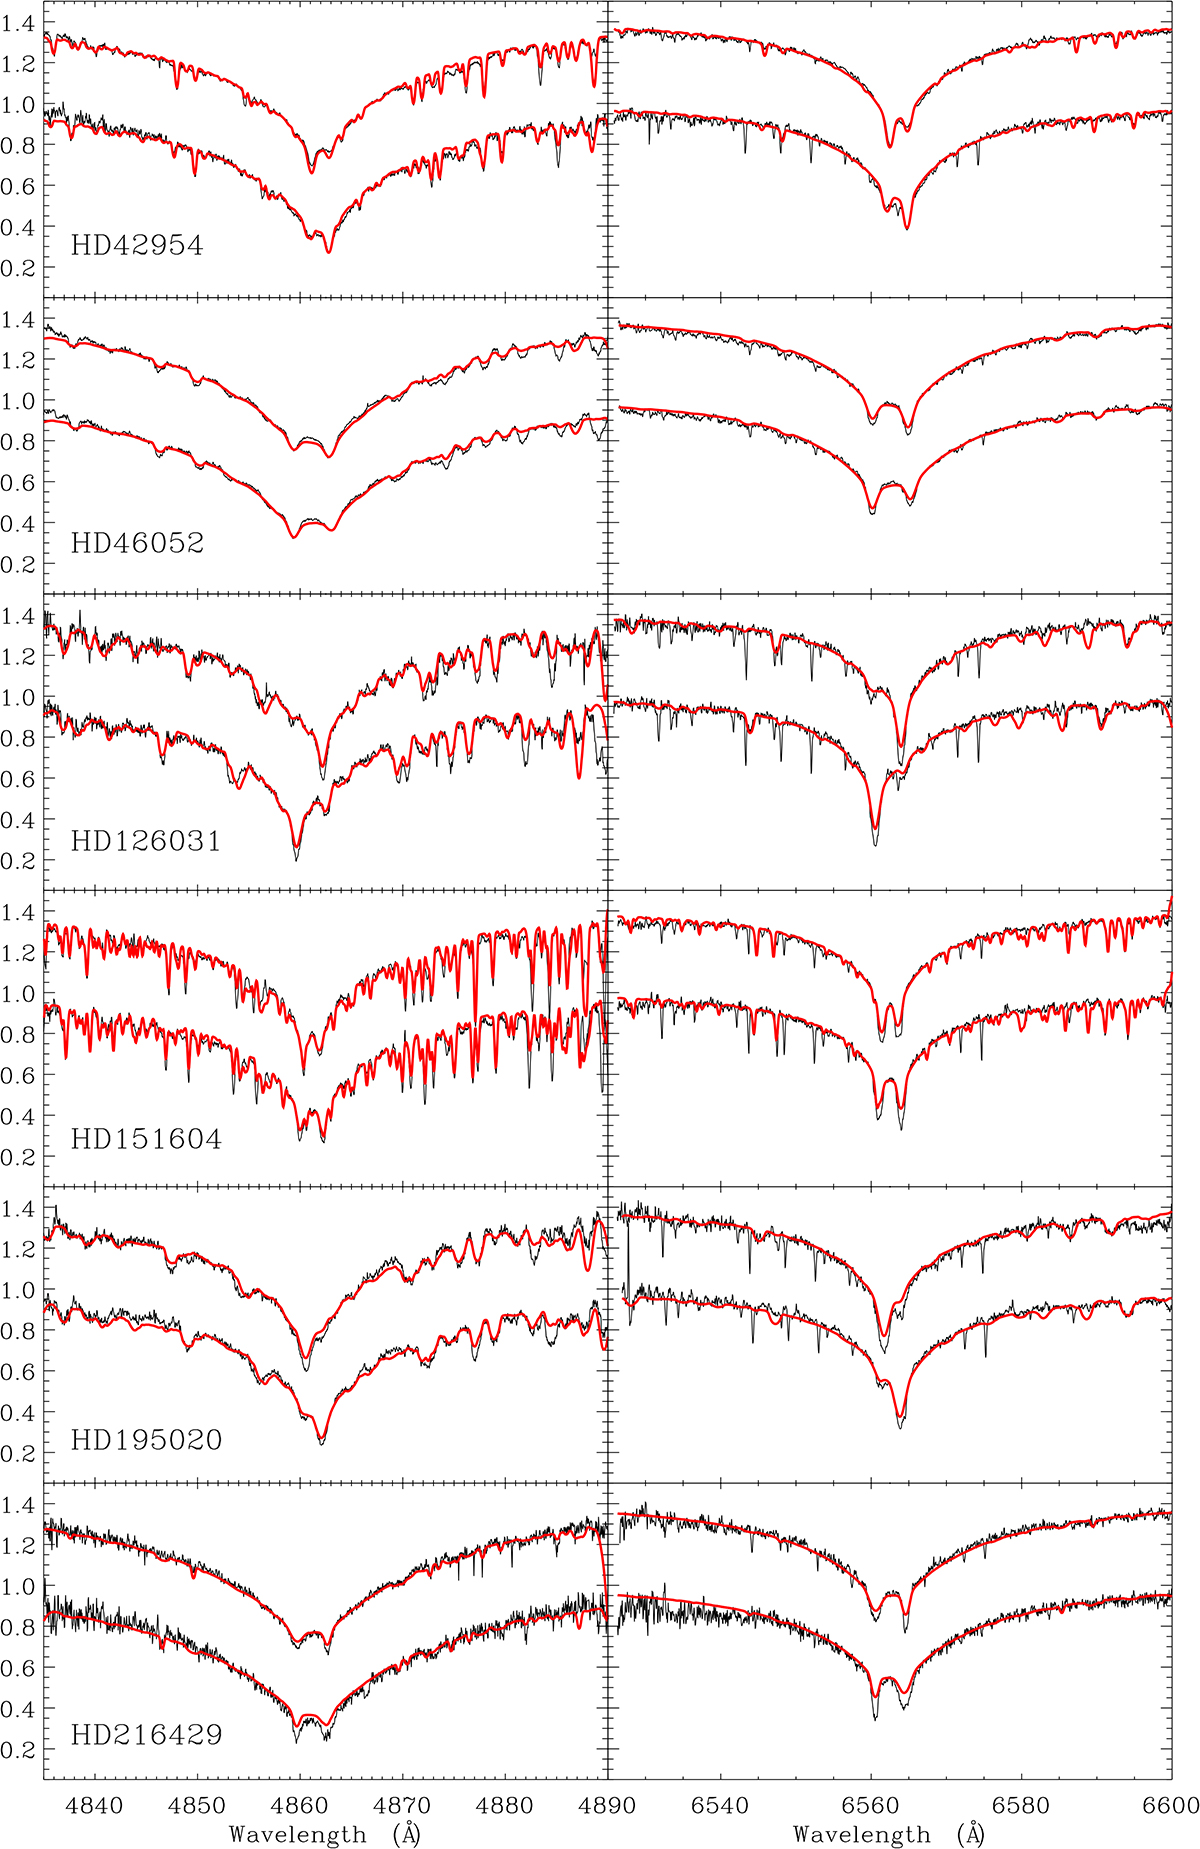
Fig. A.2.
Download original image
Results of the fitting procedure for the profiles of the Balmer lines, Hβ (left panels) and Hα (right panels), for the stars observed in this study. Two spectra corresponding to the quadrature orbital phases are displayed in each panel. The synthetic composite spectra are represented in red, while the observed ones are shown in black.
Current usage metrics show cumulative count of Article Views (full-text article views including HTML views, PDF and ePub downloads, according to the available data) and Abstracts Views on Vision4Press platform.
Data correspond to usage on the plateform after 2015. The current usage metrics is available 48-96 hours after online publication and is updated daily on week days.
Initial download of the metrics may take a while.