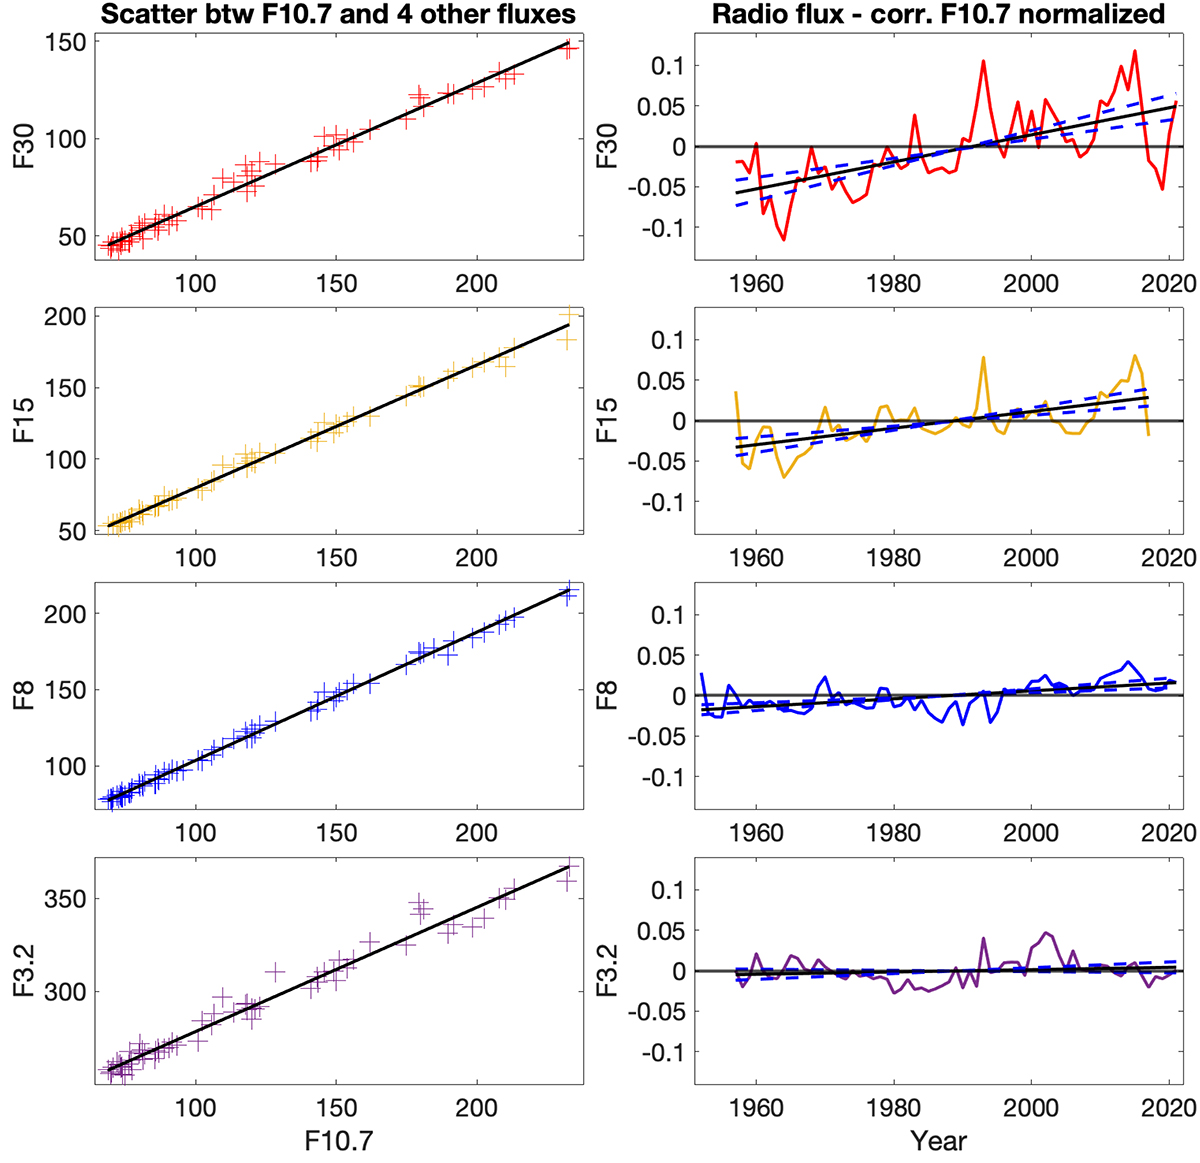
Fig. 5.
Download original image
Correlation between the yearly values of the 10.7 cm radio flux and the four other radio fluxes. Left column: scatterplots between 10.7 cm and the four radio fluxes (colored crosses), together with the corresponding best-fit lines (black). Right column: differences between the four radio fluxes and the correlated 10.7 cm radio flux normalized by the corresponding radio flux. Best-fit lines (black solid lines) and lines with slopes that are two standard deviations above or below the best-fit line slope (two blue dashed lines) are also included. Order of radio wavelengths and their colors are the same as in Fig. 1. (F10.7 is naturally omitted.)
Current usage metrics show cumulative count of Article Views (full-text article views including HTML views, PDF and ePub downloads, according to the available data) and Abstracts Views on Vision4Press platform.
Data correspond to usage on the plateform after 2015. The current usage metrics is available 48-96 hours after online publication and is updated daily on week days.
Initial download of the metrics may take a while.