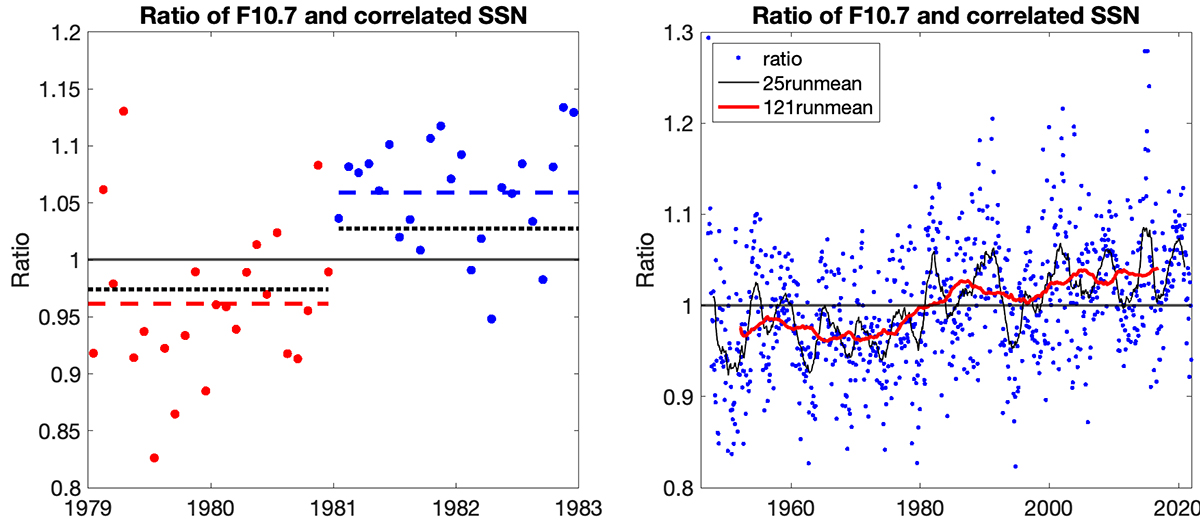
Fig. 3.
Download original image
Ratios between the monthly F10.7 fluxes and the correlated sunspot numbers. Left: ratios for 1979–1982, with ratios in 1979–1980 depicted as red dots and in 1981–1982 as blue dots (cf. Fig. 24 of Clette 2021). Red and blue dashed lines denote the means of ratios (dots) over the corresponding 2-year periods. Two black dotted lines depict the overall means of ratios over 1947–1980 and 1981–2015. Right: same monthly ratios (blue dots) for the time interval 1947–2021. Black and red curves denote the 25-month (roughly two-year) and 121-month (roughly 10-year) running means of the monthly ratios.
Current usage metrics show cumulative count of Article Views (full-text article views including HTML views, PDF and ePub downloads, according to the available data) and Abstracts Views on Vision4Press platform.
Data correspond to usage on the plateform after 2015. The current usage metrics is available 48-96 hours after online publication and is updated daily on week days.
Initial download of the metrics may take a while.