Open Access
Fig. 1.
Download original image
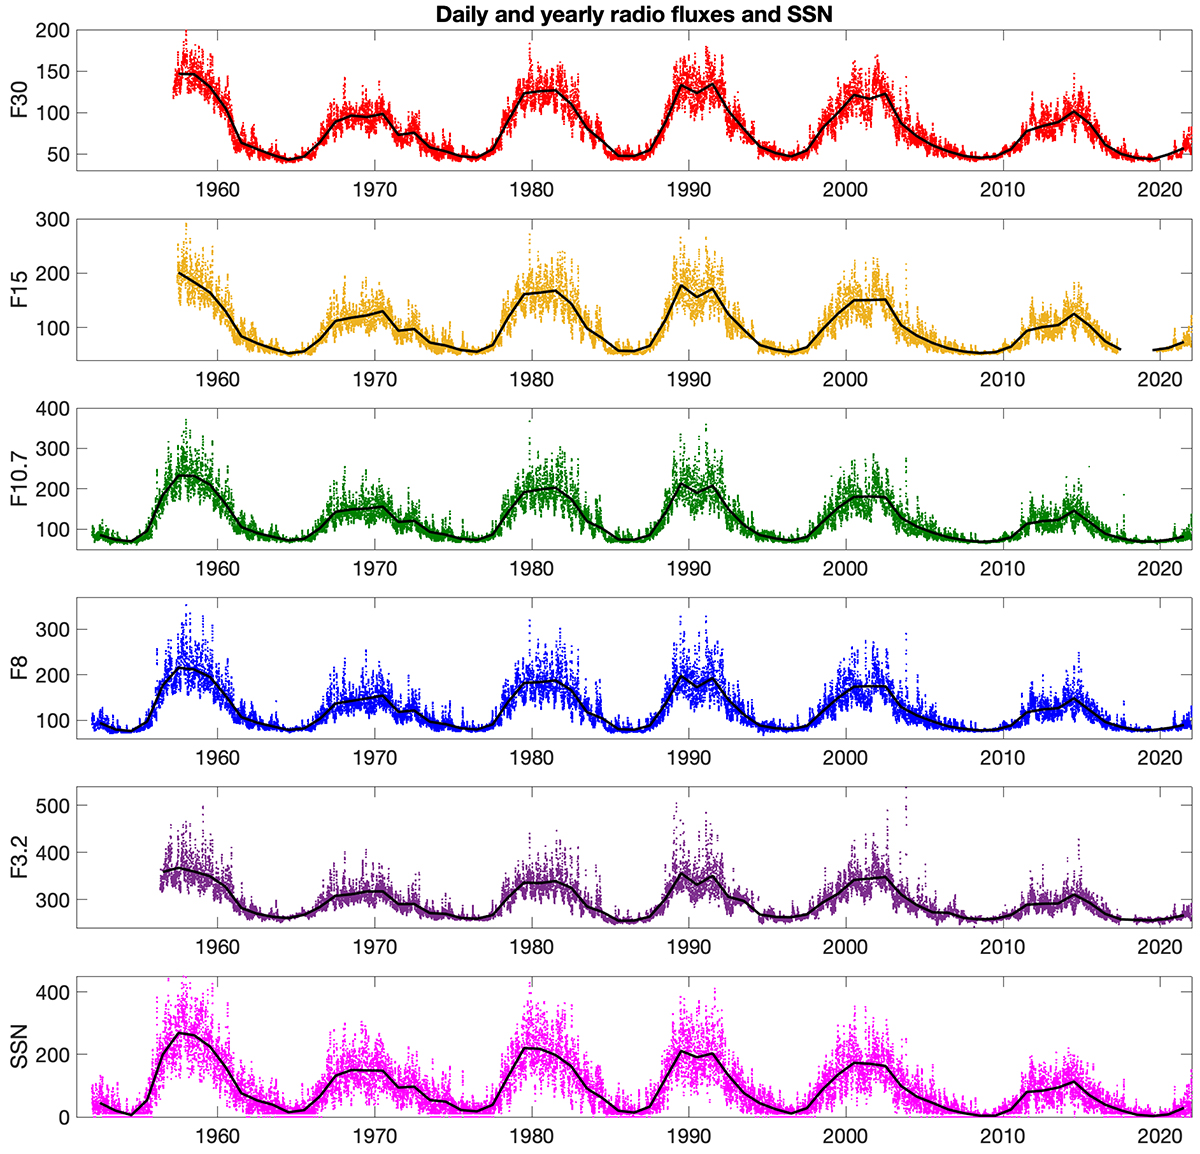
Daily (colored dots) and yearly (black lines) means of radio fluxes at five different wavelength bands from top to bottom: F30 cm (red), F15 cm (yellow), F10.7 cm (green), F8 cm (blue), and F3.2 cm (purple). Daily (magenta dots) and yearly (black line) sunspot number are depicted in the bottom panel.
Current usage metrics show cumulative count of Article Views (full-text article views including HTML views, PDF and ePub downloads, according to the available data) and Abstracts Views on Vision4Press platform.
Data correspond to usage on the plateform after 2015. The current usage metrics is available 48-96 hours after online publication and is updated daily on week days.
Initial download of the metrics may take a while.