Fig. 5.
Download original image
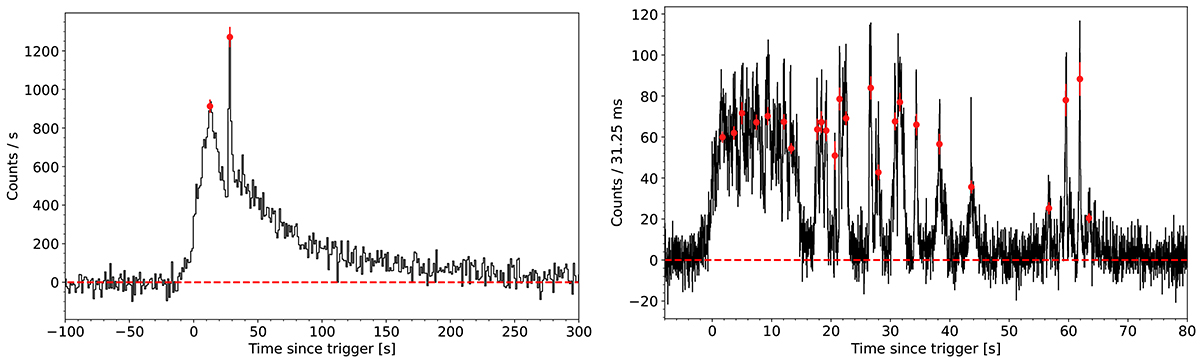
Examples of two GRBs having only 2 (left, 981203A) and 24 peaks (right, 010412), respectively, as observed in the 40−700 keV passband by BeppoSAX/GRBM. The red points show the identified peaks, while dashed lines show the interpolated background. The fluence and peak flux of the two GRBs are very similar (Frontera et al. 2009).
Current usage metrics show cumulative count of Article Views (full-text article views including HTML views, PDF and ePub downloads, according to the available data) and Abstracts Views on Vision4Press platform.
Data correspond to usage on the plateform after 2015. The current usage metrics is available 48-96 hours after online publication and is updated daily on week days.
Initial download of the metrics may take a while.