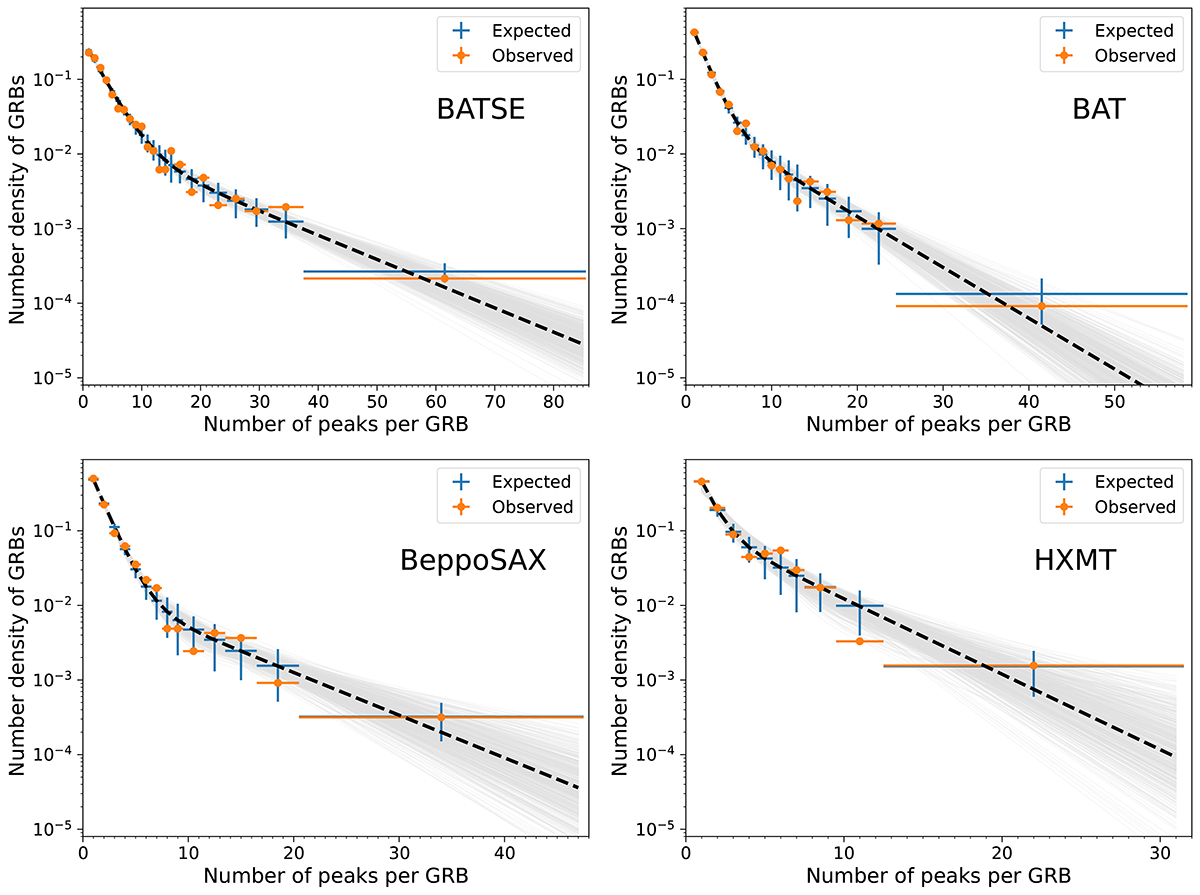
Fig. 1.
Download original image
Distributions of number of GRBs per number of peaks for different catalogues: CGRO/BATSE (top left), Swift/BAT (top right), BeppoSAX/GRBM (bottom left), and Insight-HXMT (bottom right). Observed data and expected counts are shown in orange and blue, respectively. All histograms have been grouped so as to ensure a minimum number of counts per bin. Dashed lines show the best mixture model of two exponentials that fit each distribution. Grey models are the result of a random sampling of the posterior distribution of the parameters as determined via MCMC.
Current usage metrics show cumulative count of Article Views (full-text article views including HTML views, PDF and ePub downloads, according to the available data) and Abstracts Views on Vision4Press platform.
Data correspond to usage on the plateform after 2015. The current usage metrics is available 48-96 hours after online publication and is updated daily on week days.
Initial download of the metrics may take a while.