Fig. 8
Download original image
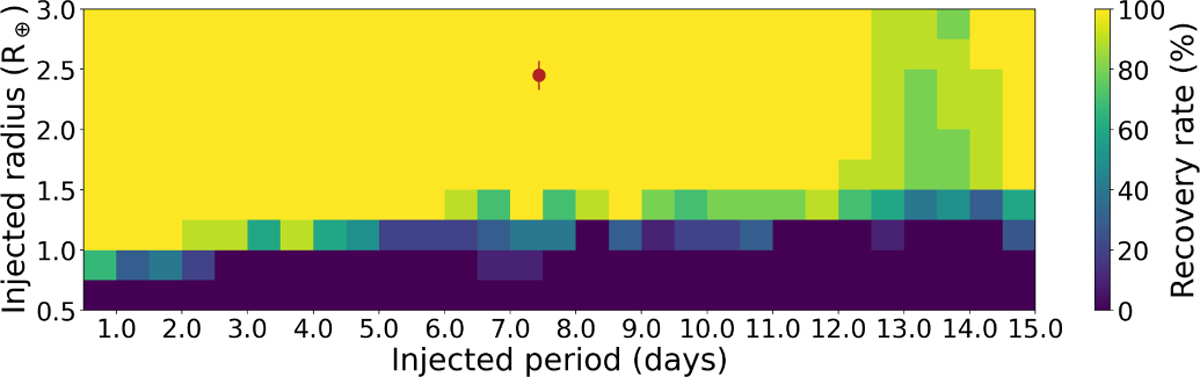
The resulting detectability map from the injection-and-retrieval experiment. Each pixel corresponds to ten of the 3000 different scenarios, that is, 10 light curves with injected planets having different Pplanet, Rplanet, and T0. Larger recovery rates are presented in yellow and green colors, while lower recovery rates are shown in blue and darker hues. The red dot refers to TOI-4438 b, which has a recovery rate of 100%, highlighting the ease of detecting mini-Neptunes in this TESS data set with orbital periods shorter than 15 d.
Current usage metrics show cumulative count of Article Views (full-text article views including HTML views, PDF and ePub downloads, according to the available data) and Abstracts Views on Vision4Press platform.
Data correspond to usage on the plateform after 2015. The current usage metrics is available 48-96 hours after online publication and is updated daily on week days.
Initial download of the metrics may take a while.