Open Access
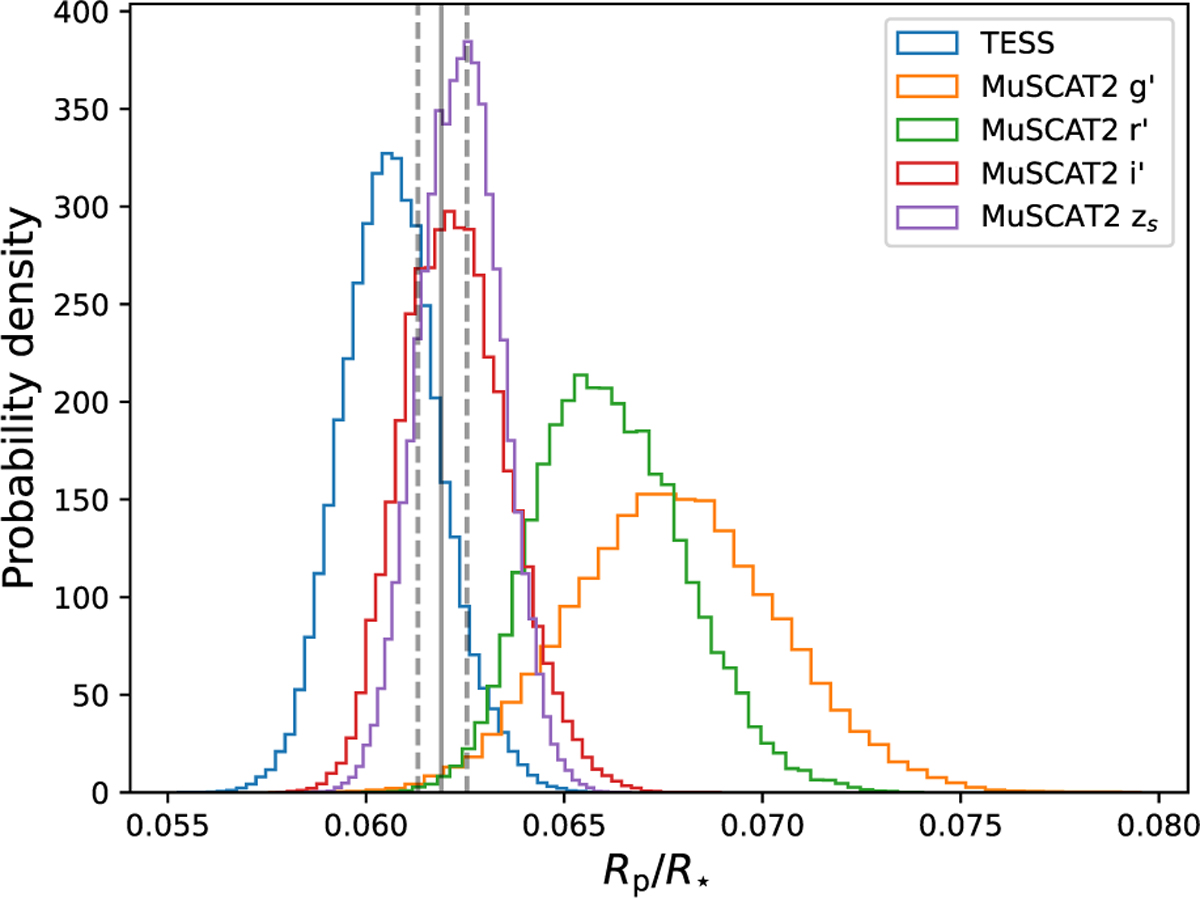
Fig. 6
Download original image
Posterior distributions of the sampled scaled planetary radii Rb/R★ for the TESS and MuSCAT2 g′, r′, i′, zs bands. The solid and dotted, vertical, gray lines mark the median and the 68.3% credibility interval of the Rp/R★’s posterior distribution, as derived in case 2 (see Sect. 4.1).
Current usage metrics show cumulative count of Article Views (full-text article views including HTML views, PDF and ePub downloads, according to the available data) and Abstracts Views on Vision4Press platform.
Data correspond to usage on the plateform after 2015. The current usage metrics is available 48-96 hours after online publication and is updated daily on week days.
Initial download of the metrics may take a while.