Fig. B.1
Download original image
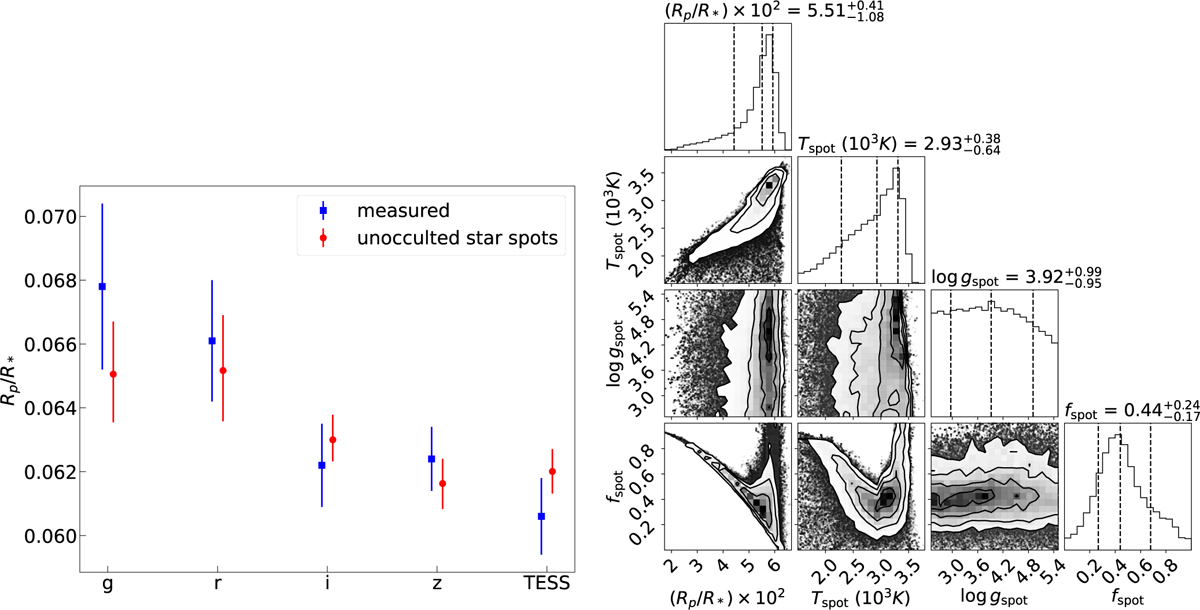
Results of the photometric fit with unocculted star spots. Left: Individual transit depths derived from photometric observations (blue squares) and best-fit model assuming that the color-dependence is due to unocculted star spots. Right: corner plot with the posterior distribution of the model parameters, generated with the corner package (Foreman-Mackey 2016).
Current usage metrics show cumulative count of Article Views (full-text article views including HTML views, PDF and ePub downloads, according to the available data) and Abstracts Views on Vision4Press platform.
Data correspond to usage on the plateform after 2015. The current usage metrics is available 48-96 hours after online publication and is updated daily on week days.
Initial download of the metrics may take a while.