Fig. 16
Download original image
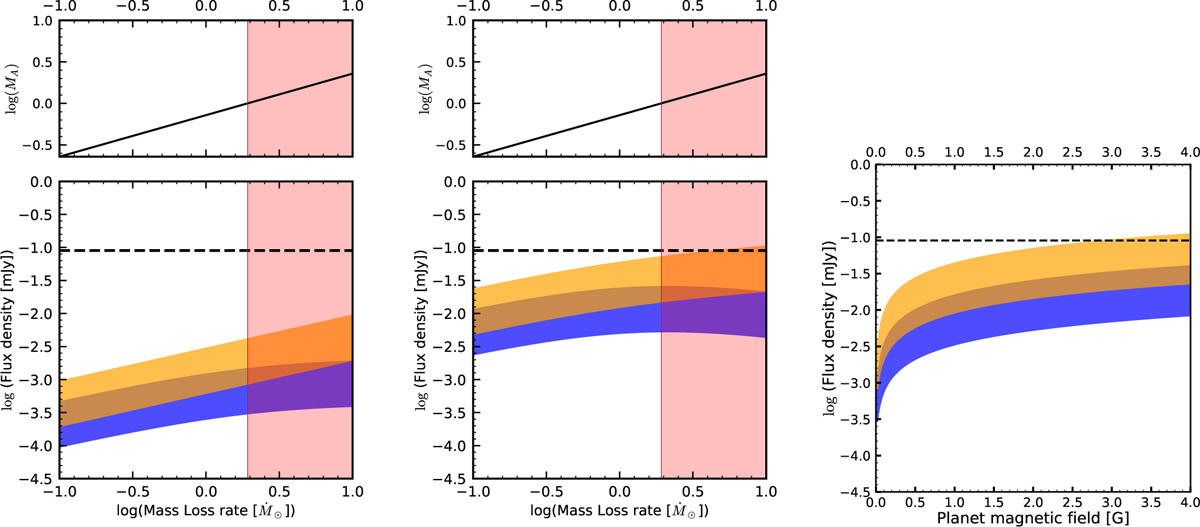
Flux density arising from star planet interaction as a function of stellar mass-loss rate (left and center) and the magnetic field of the planet (right). The emission expected from Saur–Turnpenney’s model is shown in orange, while the emission expected from Zarka-Lanza’s model is shown in blue. The overlap between both models is shown in brown. We show in pale red color the region when the planet is in the super-Alfvènic regime. The dashed black line represents an assumed detection threshold of 100 µJy. For the variation with respect to the magnetic field of the planet we used M = 1.92 Ṁ⊙, which is the maximum value for the mass loss rate before entering the sub-Alfvènic regime. Left: expected flux density for an unmagnetized planet in a closed dipolar geometry, as a function of the stellar wind mass loss. The pale red colored region indicates the super-Alfvénic case, when our approach no longer applies. Center: the same as in the left panel, but for a magnetized planet with Bp = 2 G. Right: expected flux density for a closed dipolar geometry
Current usage metrics show cumulative count of Article Views (full-text article views including HTML views, PDF and ePub downloads, according to the available data) and Abstracts Views on Vision4Press platform.
Data correspond to usage on the plateform after 2015. The current usage metrics is available 48-96 hours after online publication and is updated daily on week days.
Initial download of the metrics may take a while.