Open Access
Fig. 6
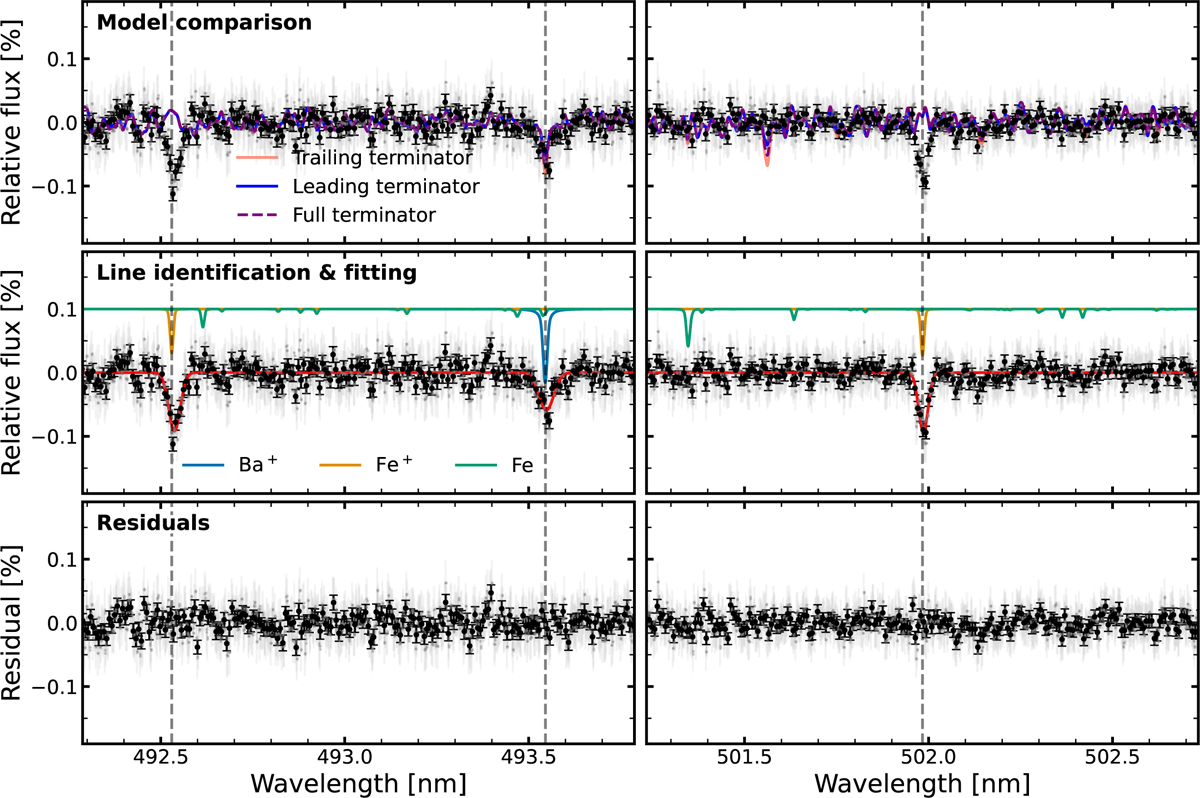
Download original image
Same as Fig. 3 but for Ba+, Fe, and Fe+. The templates for atoms and ions are shown at a temperature of 3000 K and 4000 K, respectively. To the right of the Fe, there is an unidentified absorption line, while to the left, the model predicts absorption by Ti.
Current usage metrics show cumulative count of Article Views (full-text article views including HTML views, PDF and ePub downloads, according to the available data) and Abstracts Views on Vision4Press platform.
Data correspond to usage on the plateform after 2015. The current usage metrics is available 48-96 hours after online publication and is updated daily on week days.
Initial download of the metrics may take a while.