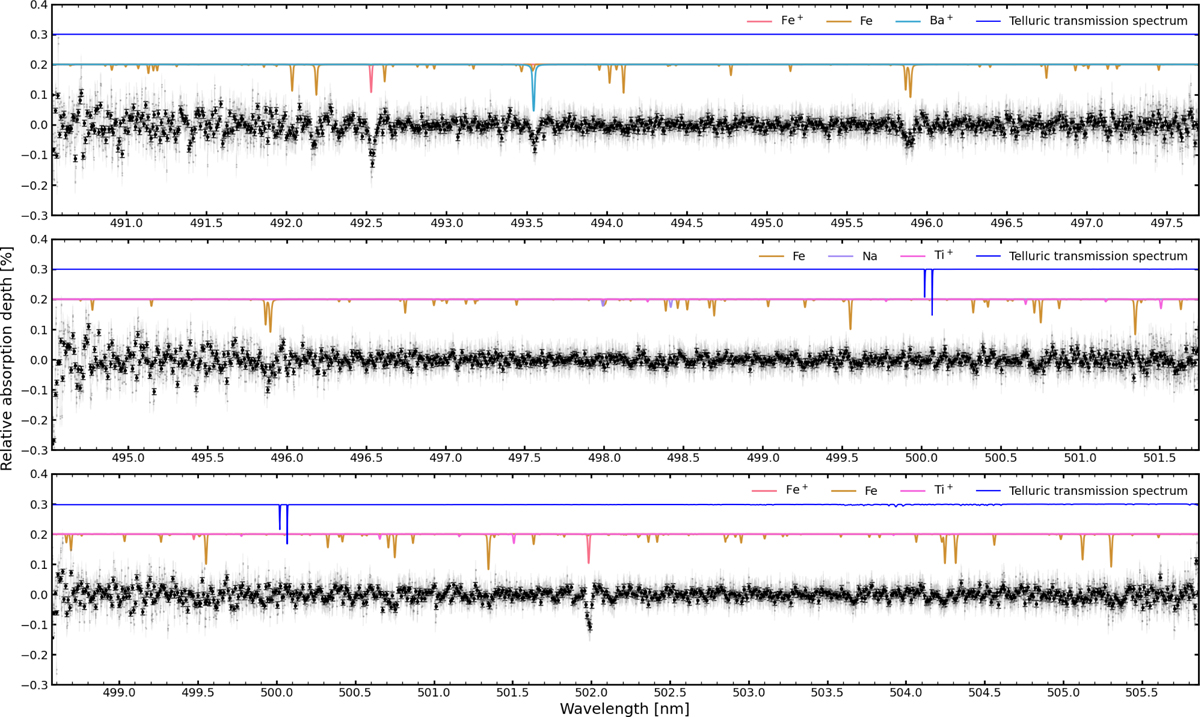
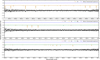
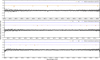
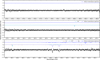
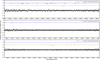
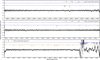
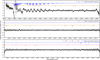
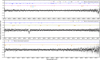
Fig. B.1
Download original image
Spectral atlas of the blue arm of MAROON-X. The grey data points show the unbinned transmission spectrum for each spectral order. The black data points provide the binned spectrum (x10). Additionally, the templates with significant absorption lines are plotted to identify the absorption lines in the transmission spectrum. The templates have been broadened to fit the resolution of the spectrograph. The dark blue spectrum shows a model telluric transmission spectrum to identify heavily contaminated regions.
Current usage metrics show cumulative count of Article Views (full-text article views including HTML views, PDF and ePub downloads, according to the available data) and Abstracts Views on Vision4Press platform.
Data correspond to usage on the plateform after 2015. The current usage metrics is available 48-96 hours after online publication and is updated daily on week days.
Initial download of the metrics may take a while.