Fig. C.2.
Download original image
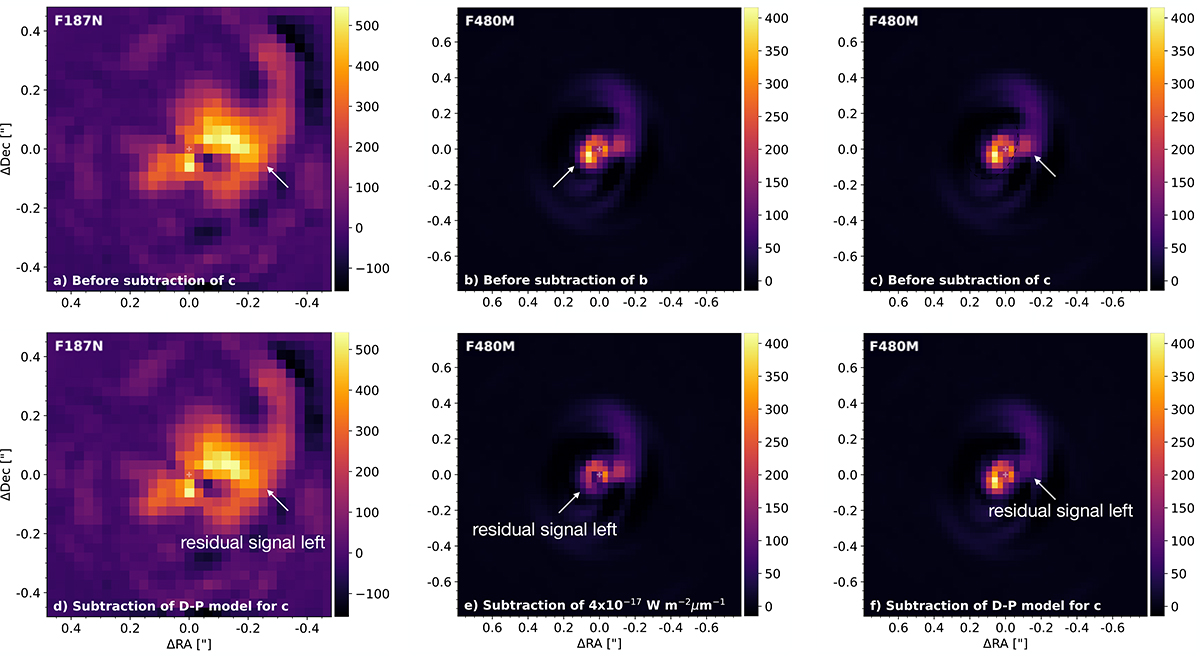
Images obtained at 1.87μm (F187N; first column) and 4.80μm (F480M; middle and right columns) before (top row) and after (bottom row) subtraction of point-source models at the location of protoplanets c (first and last column) and b (middle column) using fluxes different than the optimal ones found with NEGFC. We test whether the predicted flux for planet c with the DRIFT-PHOENIX model presented in Wang et al. (2021b) could account for the observed flux in the F187N (panels a vs. d) and F480M (panels c vs. f) images at the location of c. We also show the F480M image obtained after subtracting the lower uncertainty limit from the optimal flux found by NEGFC for planet b (panels b vs. e), which illustrates our uncertainty associated with the underlying inner-disk signal contribution.
Current usage metrics show cumulative count of Article Views (full-text article views including HTML views, PDF and ePub downloads, according to the available data) and Abstracts Views on Vision4Press platform.
Data correspond to usage on the plateform after 2015. The current usage metrics is available 48-96 hours after online publication and is updated daily on week days.
Initial download of the metrics may take a while.