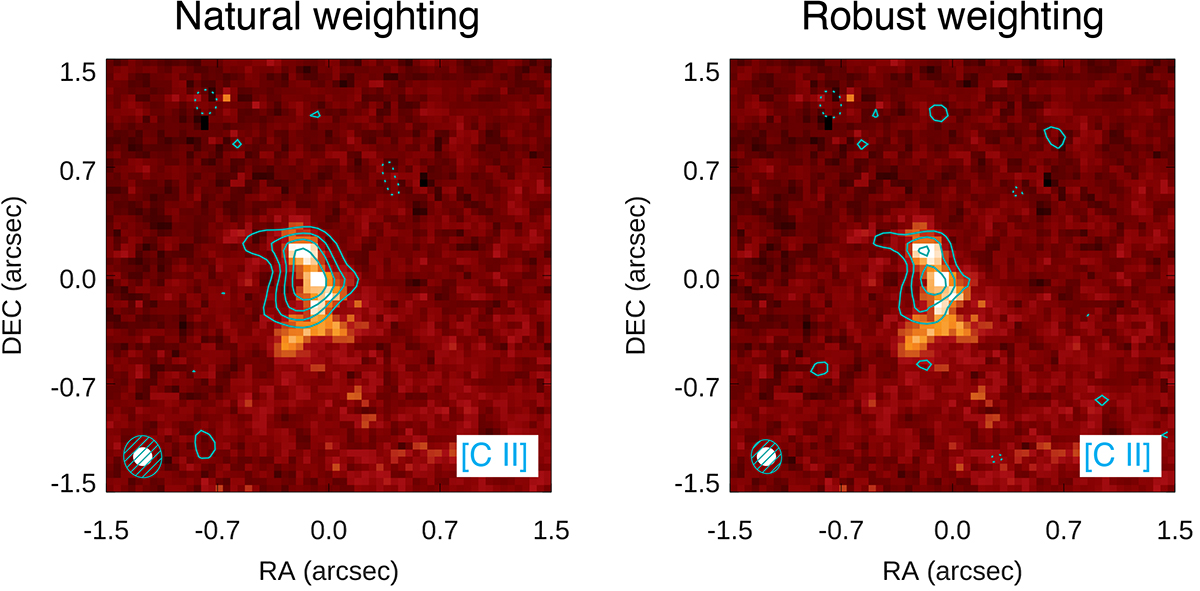
Fig. A.1.
Download original image
Comparison of UV and the [C II] morphology obtained by simulating mock ALMA data for the galaxy image M1. Left panel: HST UV continuum data (background image) overlaid with the [C II] data obtained with natural weighting (contours). The cyan solid and dashed contours indicate respectively positive and negative levels of 3, 5, 7, 9 rms. The ALMA beam is reported as the cyan ellipse, while the HST PSF is reported as the white filled ellipse. Right panel: HST UV continuum data (background image) overlaid with the [C II] data obtained with robust weighting (contours). Contour levels are the same as in the left panel. Each stamp has a size of 3″ × 3″.
Current usage metrics show cumulative count of Article Views (full-text article views including HTML views, PDF and ePub downloads, according to the available data) and Abstracts Views on Vision4Press platform.
Data correspond to usage on the plateform after 2015. The current usage metrics is available 48-96 hours after online publication and is updated daily on week days.
Initial download of the metrics may take a while.