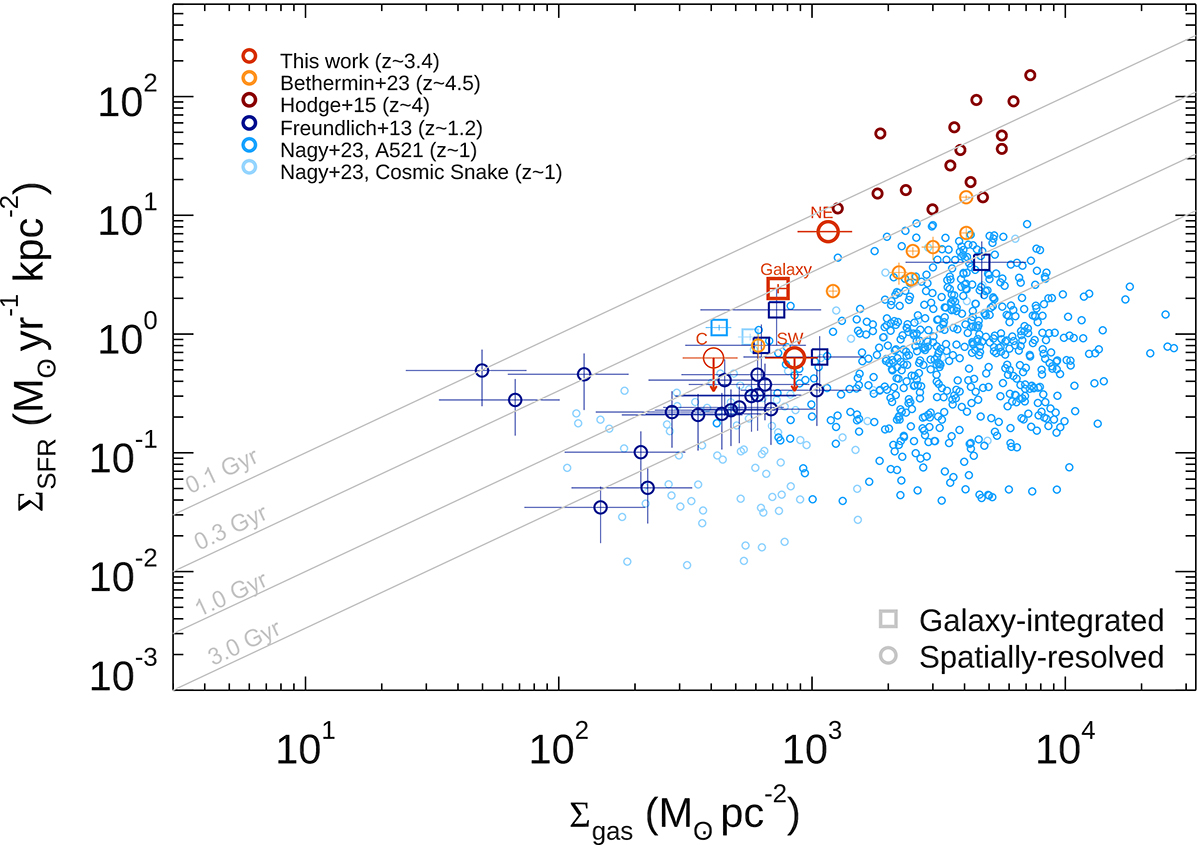
Fig. 7.
Download original image
Clumps location in the Schmidt–Kennicutt plane. We compare our findings (red symbols), with available subkiloparsec observations from the literature at z ∼ 1 − 4 (colored symbols, Freundlich et al. 2013; Hodge et al. 2015; Nagy et al. 2023; Béthermin et al. 2023). Galaxy-integrated measurements are reported as squares, while spatially resolved measurements as circles. Clump C, which is considered as tentative, is indicated with the red, thinner, circle. We also indicate lines of constant depletion time (gray lines).
Current usage metrics show cumulative count of Article Views (full-text article views including HTML views, PDF and ePub downloads, according to the available data) and Abstracts Views on Vision4Press platform.
Data correspond to usage on the plateform after 2015. The current usage metrics is available 48-96 hours after online publication and is updated daily on week days.
Initial download of the metrics may take a while.