Fig. 6.
Download original image
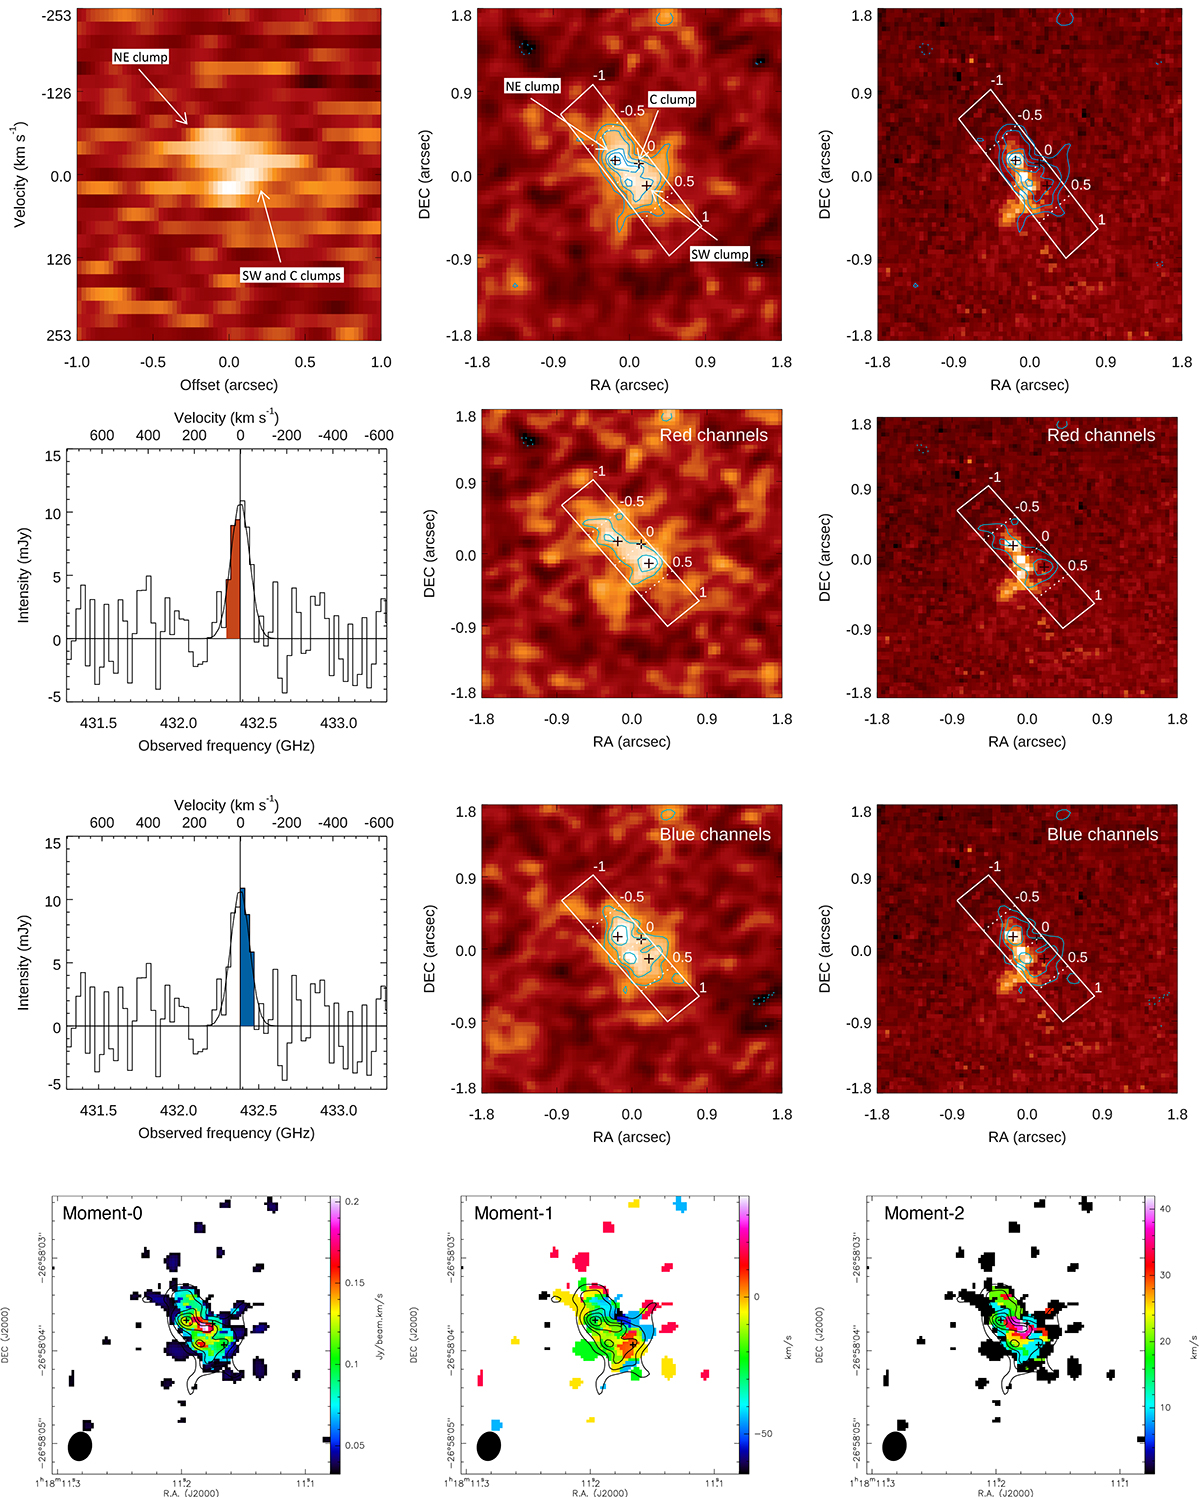
Dynamical properties of M1. First row, left panel: position-velocity diagram of the [C II] emission extracted along the slit shown in the next panels. First row, middle panel: [C II] map (background) overlaid with the [C II] (3, 4, 5, 5.5, 6) rms contours (cyan) and the slit used to extract the PV diagram (white). The dashed lines mark offsets of 0.5″ along the slit. First row, right panel: UV continuum imaging (background) and [C II] contours overlaid. Second row, left panel: 1D spectrum showing the integrated [C II] emission. In red we highlight the channels used to create the intensity map shown in the next panel. Second row, middle panel: [C II] intensity map obtained by averaging only the channels with positive velocity with respect to systemic (“red channels”) overlaid with (3, 4, 5) rms contours. Second row, right panel: UV continuum (background), with [C II] contours. Other symbols are as in previous panels. Third row, left panel: 1D [C II] spectrum, with channels used to produce the intensity maps of the next panel highlighted in blue. Third row, middle panel: [C II] intensity map obtained by averaging only the channels with negative velocity with respect to systemic (“blue channels”) with [C II] (3, 4, 5) rms contours (cyan) overlaid. Other symbols are as in previous panels. Third row, right panel: UV continuum (background) with [C II] contours overlaid. Symbols are as in previous panels. Fourth row, left panel: moment-0 map. Fourth row, middle panel: moment-1 map. Fourth row, right panel: moment-2 map. The contours are estimated from the intensity map and are the same as in Fig. 6. The black ellipse in the bottom left corner indicates the beam size. The crosses indicate the location of [C II] clumps.
Current usage metrics show cumulative count of Article Views (full-text article views including HTML views, PDF and ePub downloads, according to the available data) and Abstracts Views on Vision4Press platform.
Data correspond to usage on the plateform after 2015. The current usage metrics is available 48-96 hours after online publication and is updated daily on week days.
Initial download of the metrics may take a while.