Fig. 5.
Download original image
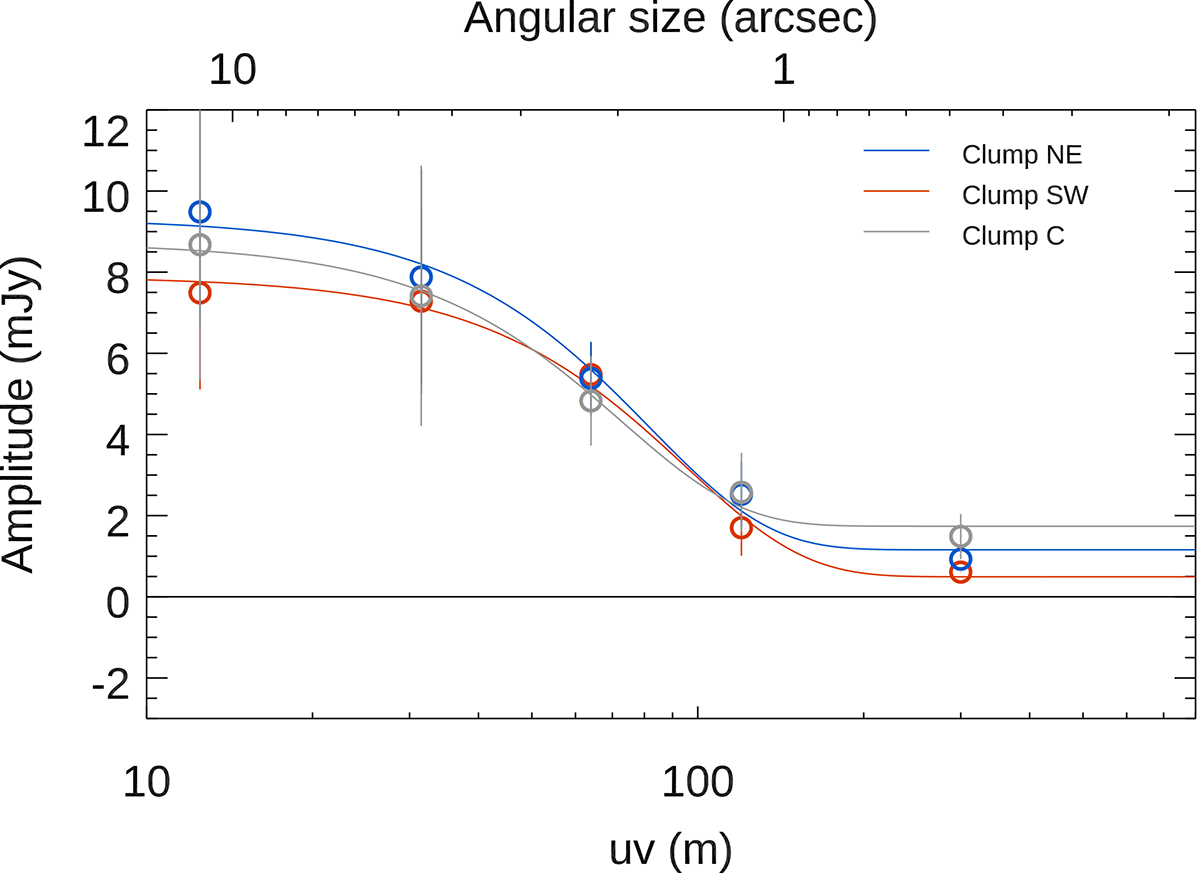
Signal amplitude as a function of the uv distance, namely the baseline length. We extracted the signal amplitude at three different spatial locations, coinciding with the NE clump (blue), the SW clump (red), and the C clump (gray). We fit each dataset with a Gaussian model plus a constant. In the image plane these best-fit functions correspond to a Gaussian with FWHM ∼ 2″ and a PSF component. An additional constant, corresponding to another PSF component, is needed to fit the measurements.
Current usage metrics show cumulative count of Article Views (full-text article views including HTML views, PDF and ePub downloads, according to the available data) and Abstracts Views on Vision4Press platform.
Data correspond to usage on the plateform after 2015. The current usage metrics is available 48-96 hours after online publication and is updated daily on week days.
Initial download of the metrics may take a while.