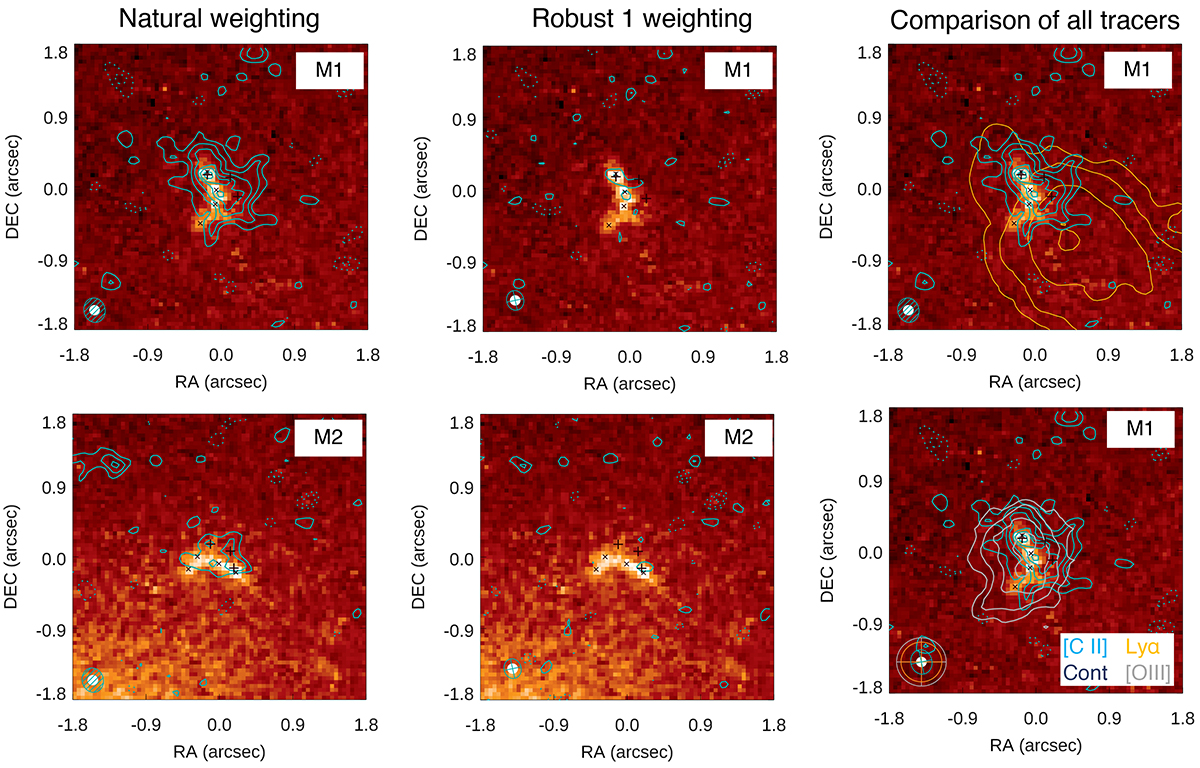
Fig. 4.
Download original image
Comparison of UV and [C II] morphology of our galaxy. We show both images covered by the primary beam, M1 and M2 (as indicated in the labels). Left panels: HST UV continuum data (background image) overlaid with the [C II] data obtained with natural weighting (contours). The cyan solid and dashed contours indicate respectively positive and negative levels of 2, 3, 4, 5, 5.5, 6 rms. The crosses indicate the location of the clumps detected in [C II], while the x indicate the location of the clumps detected in UV continuum. The ALMA beam is reported as the cyan ellipse, while the HST PSF is reported as the white-filled ellipse. Middle panels: HST UV continuum data (background image) overlaid with the [C II] data obtained with GILDAS using robust weighting and a parameter of 1 (contours). Contour levels are the same as in the left panels. Right panels: comparison of the available tracers for the galaxy image M1: UV continuum (background), [C II] (cyan contours as in previous stamps), Lyα (orange contours with levels of 3, 5, 10, 18 rms, in the top panel), [O III] (gray contours with levels of 3, 5, 8, 11 rms in the bottom panel). The beams of each tracer are reported in the bottom right panel. All stamps have a size of 3.6″ × 3.6″.
Current usage metrics show cumulative count of Article Views (full-text article views including HTML views, PDF and ePub downloads, according to the available data) and Abstracts Views on Vision4Press platform.
Data correspond to usage on the plateform after 2015. The current usage metrics is available 48-96 hours after online publication and is updated daily on week days.
Initial download of the metrics may take a while.