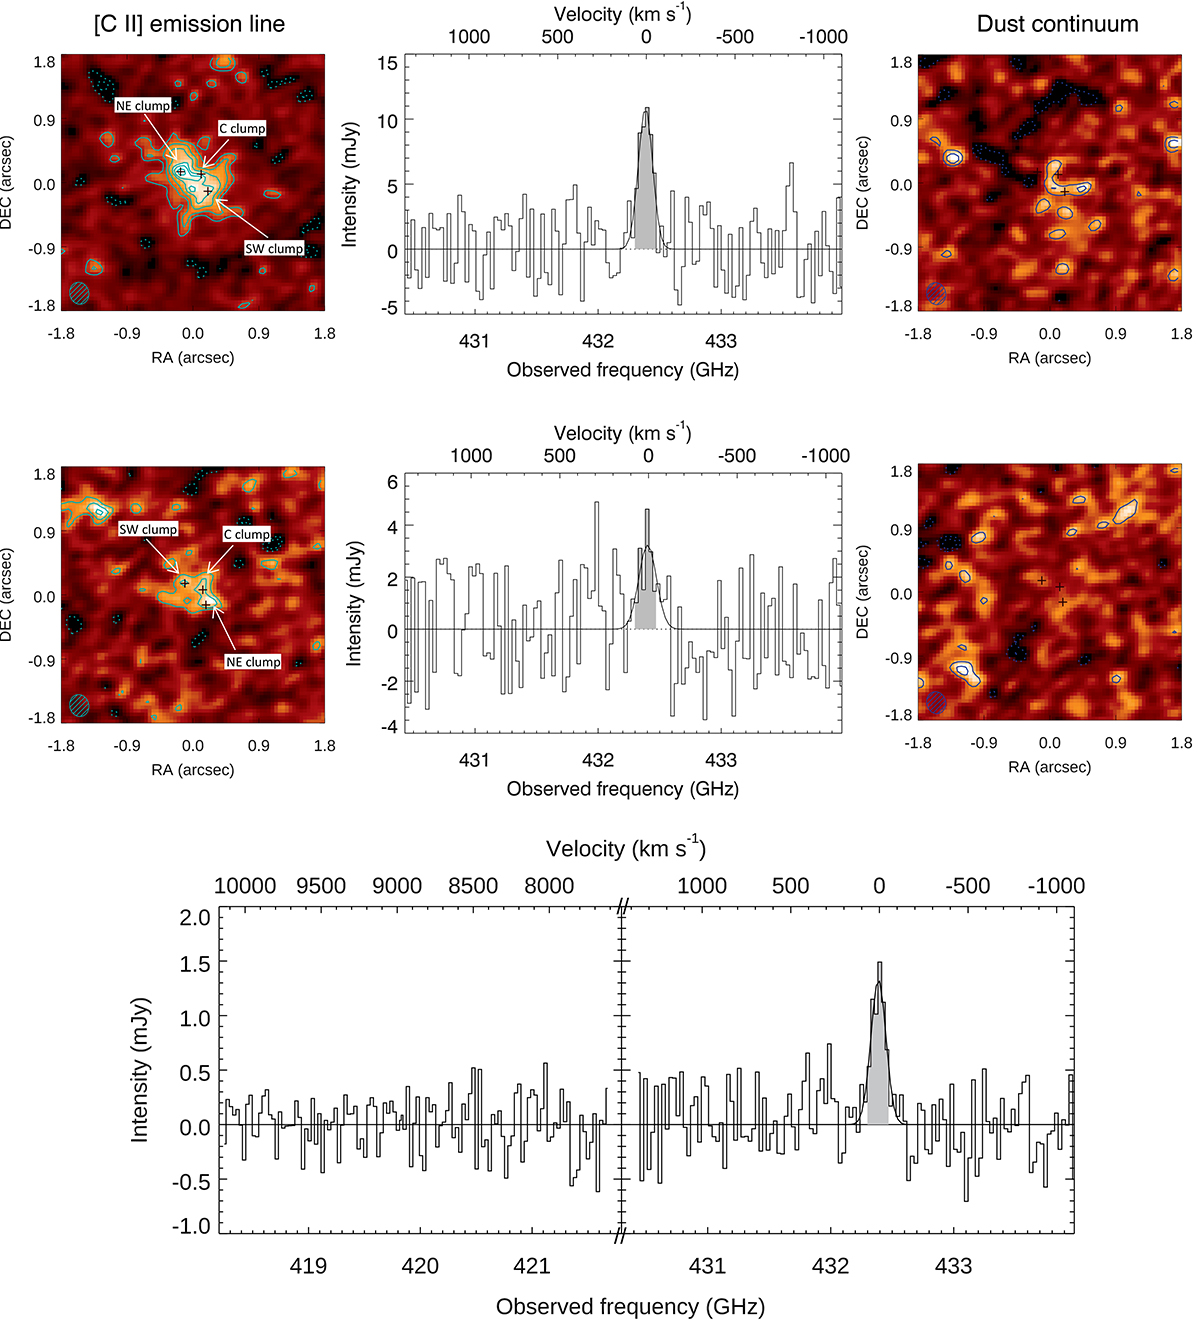
Fig. 3.
Download original image
ALMA data of our galaxy. Top and middle rows: images covered by the primary beam, M1 (top row) and M2 (middle row). Left panels: ALMA 2D maps of the [C II] line. The cyan solid and dashed contours indicate respectively positive and negative levels of 2, 3, 4, 5, 5.5, 6 rms. The crosses indicate the location of the [C II] clumps (NE, C, and SW as labeled on the figure). The beam is reported as the cyan ellipse. Each stamp has a size of 3.6″ × 3.6″. Middle panels: 1D spectrum from the ALMA datacube, extracted using the 2D Gaussian model that maximizes the S/N (Sect. 3.3). The gray shaded areas indicate the velocity range over which we measured the [C II] line flux. For illustrative purposes we also report the Gaussian fit of the emissions: it was not used to estimate the line fluxes, but only as an alternative estimate of the redshift of the galaxies (Sect. 3.3). The intensity is observed, not corrected for magnification. Right panels: ALMA 2D map of the continuum emission on the observed frequency range of 418−434 GHz. The dark blue solid and dashed contours indicate respectively positive and negative levels from 2σ to 4σ, in steps of 1σ. The intensity is observed, not corrected for magnification. Bottom row: intrinsic (magnification-corrected) stacked 1D spectrum of M1 and M2.
Current usage metrics show cumulative count of Article Views (full-text article views including HTML views, PDF and ePub downloads, according to the available data) and Abstracts Views on Vision4Press platform.
Data correspond to usage on the plateform after 2015. The current usage metrics is available 48-96 hours after online publication and is updated daily on week days.
Initial download of the metrics may take a while.