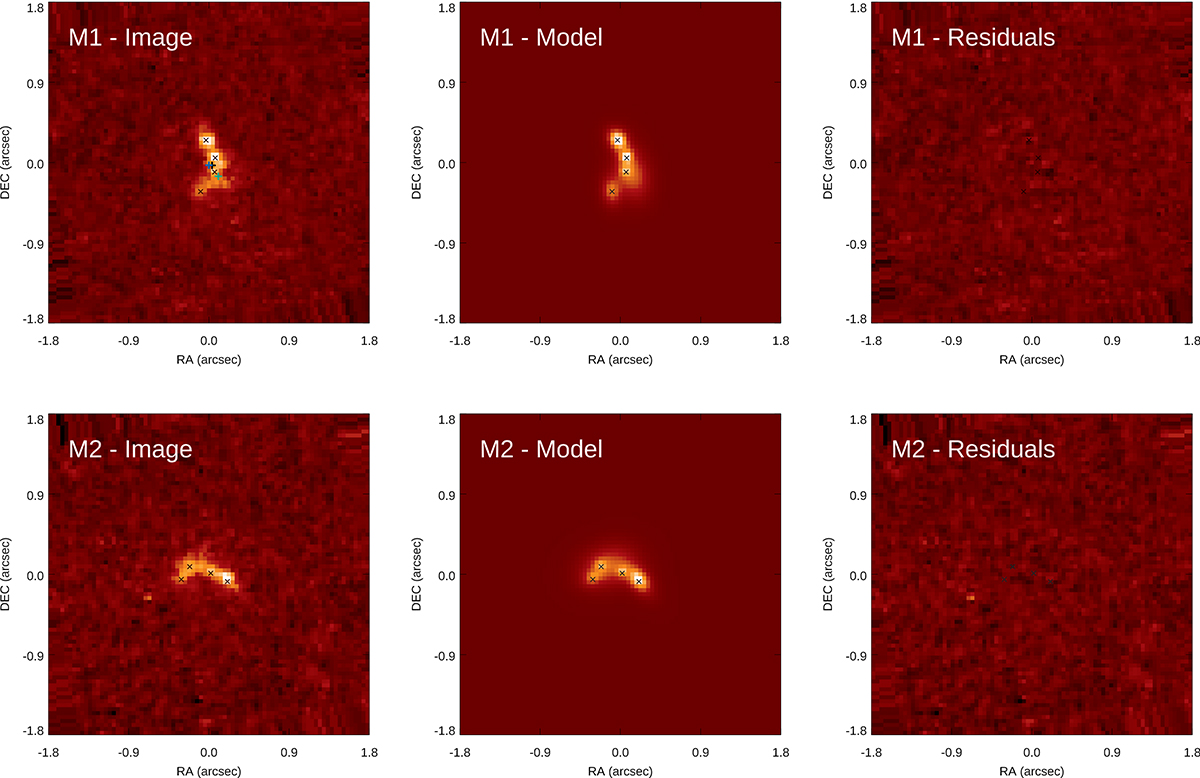
Fig. 2.
Download original image
GALFIT best-fit model of the UV continuum. We show the input image first column), the model (second column), and the residuals (third column) obtained by subtracting the model from the input image. Both galaxy images M1 (top row) and M2 (bottom row) are shown. The cutouts have a size of 3.6″ × 3.6″. The color cuts are the same in all panels of M1 and in all panels of M2. The crosses in the top left panel indicate the barycenter of the M1 galaxy image as estimated with three different methods: from the GALFIT disk-only best fit (black cross), from the GALFIT disk+clumps best fit (cyan cross), and from the SExtractor (blue cross, see Sect. 3.1 for details). The x indicate the clumps detected in the UV continuum.
Current usage metrics show cumulative count of Article Views (full-text article views including HTML views, PDF and ePub downloads, according to the available data) and Abstracts Views on Vision4Press platform.
Data correspond to usage on the plateform after 2015. The current usage metrics is available 48-96 hours after online publication and is updated daily on week days.
Initial download of the metrics may take a while.