Fig. 1.
Download original image
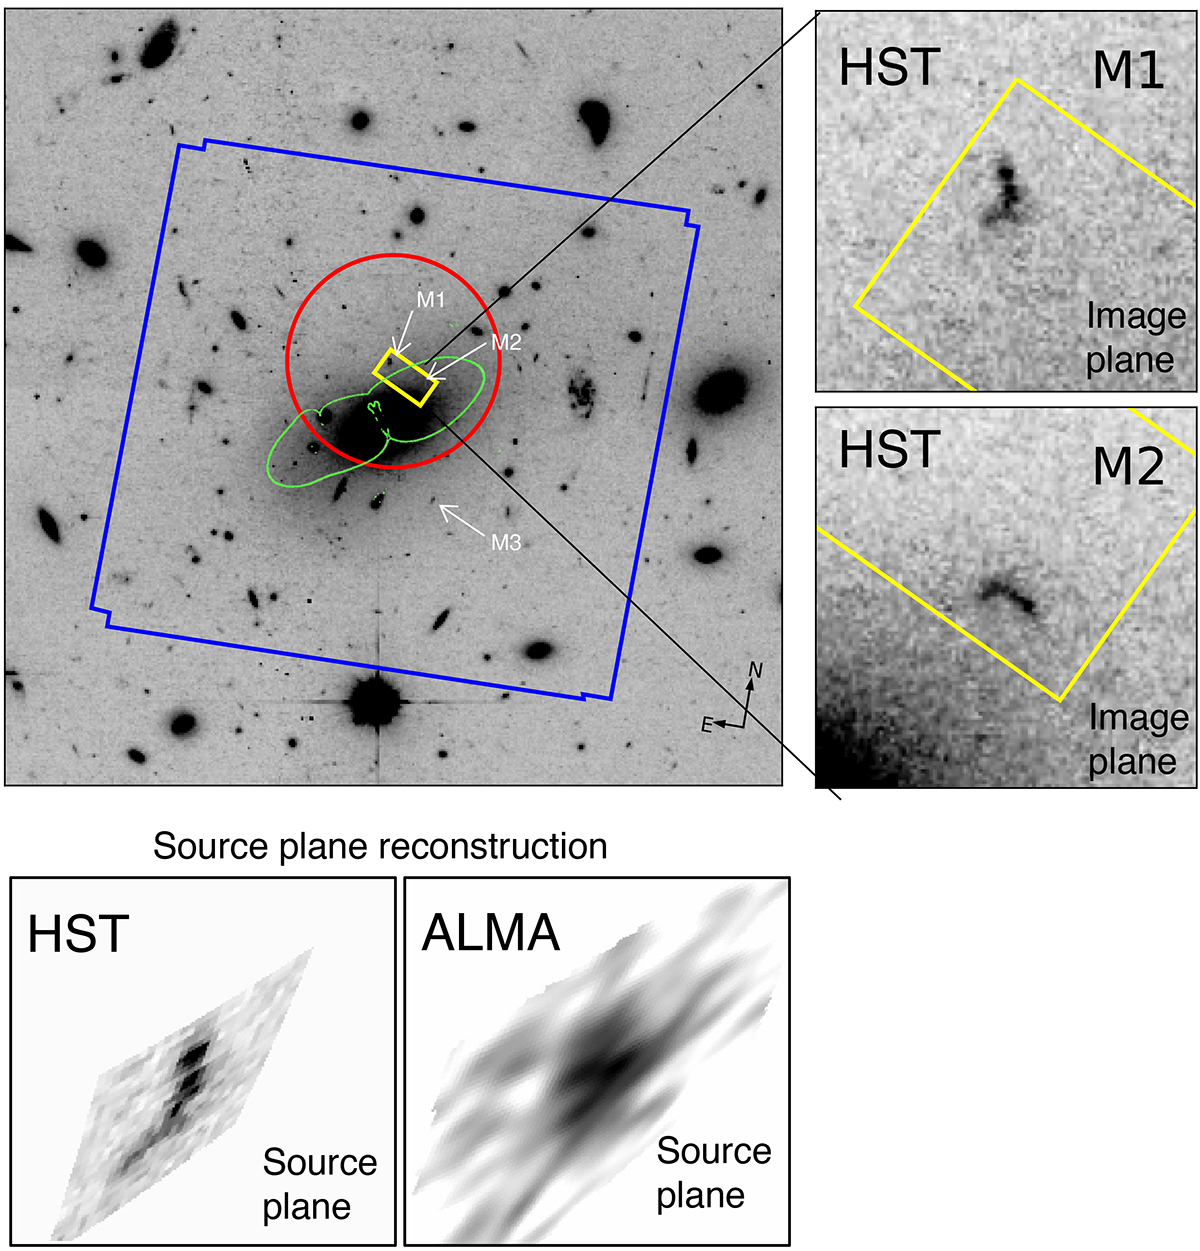
Available observations for our target galaxy. Left top panel: HST/ACS WFC F606W observations shown as the background image, whereas the contours show the MUSE WFM+AO (blue) and SINFONI (yellow) field of view. The ALMA primary beam is also shown (red circle). The SINFONI and ALMA observations cover only two of the three multiple images, namely M1 and M2. The green contours show the critical lines. Right panels: M1 (top) and M2 (bottom) multiple images of our target galaxy as detected in HST data (Livermore et al. 2015; Iani et al. 2021). Both cutouts have a size of about 5″ × 5″. Bottom panels: source plane reconstruction of our target. We show both the UV continuum from HST data (left) and the [C II] emission from ALMA data (right). Both cutouts have a size of 1″ × 1″.
Current usage metrics show cumulative count of Article Views (full-text article views including HTML views, PDF and ePub downloads, according to the available data) and Abstracts Views on Vision4Press platform.
Data correspond to usage on the plateform after 2015. The current usage metrics is available 48-96 hours after online publication and is updated daily on week days.
Initial download of the metrics may take a while.