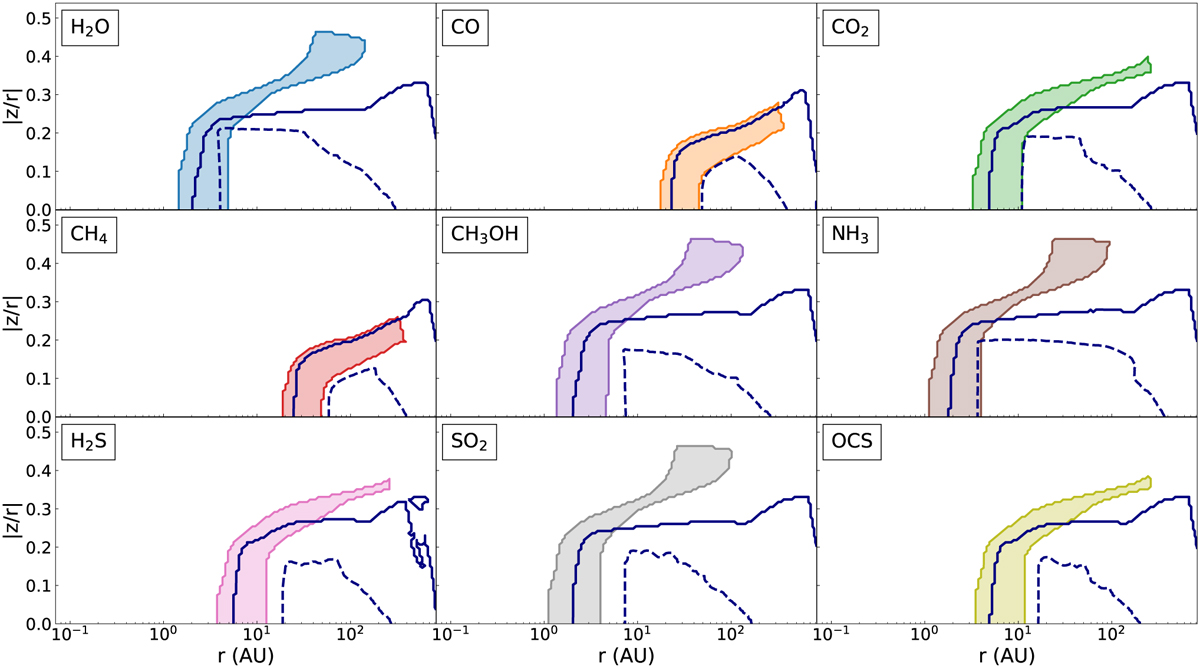
Fig. 9
Download original image
Map of the spatial zone where diffusion is expected to significantly affect the ice evolution of monomers for the eight chemical species considered throughout this work. The dark blue lines indicate the ice line of the respective species informed from either the 50% condensation threshold in the background model (solid) or the location where the adsorption and desorption rates are equal (dashed).
Current usage metrics show cumulative count of Article Views (full-text article views including HTML views, PDF and ePub downloads, according to the available data) and Abstracts Views on Vision4Press platform.
Data correspond to usage on the plateform after 2015. The current usage metrics is available 48-96 hours after online publication and is updated daily on week days.
Initial download of the metrics may take a while.